Overview
Sidebar: Overview
Address: /#/dashboard
Overview is the home page. It summarizes the cluster. The cards and charts do not open other pages. Use the sidebar when you want a list or a detail panel.
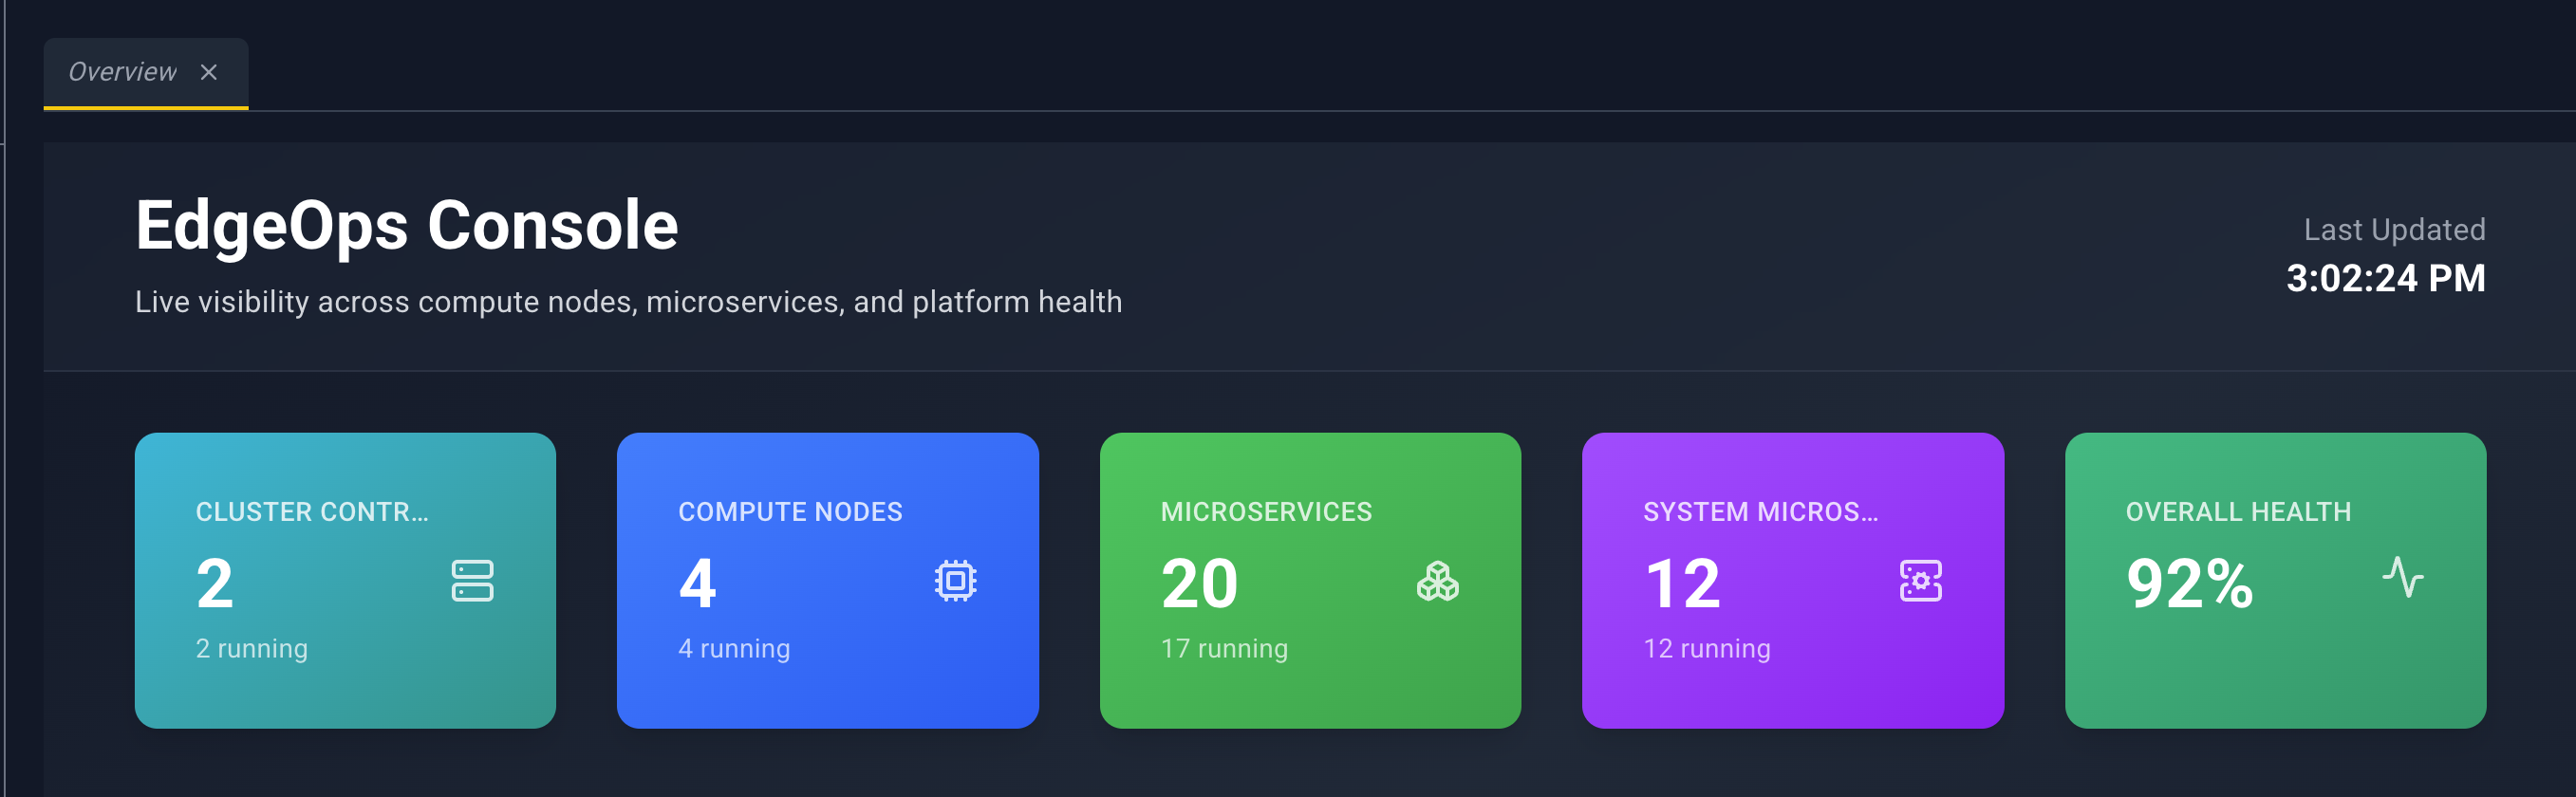
The header stays pinned while you scroll. It shows EdgeOps Console, the line Live visibility across compute nodes, microservices, and platform health, and Last Updated with the clock from the moment the page rendered.
Metric cards
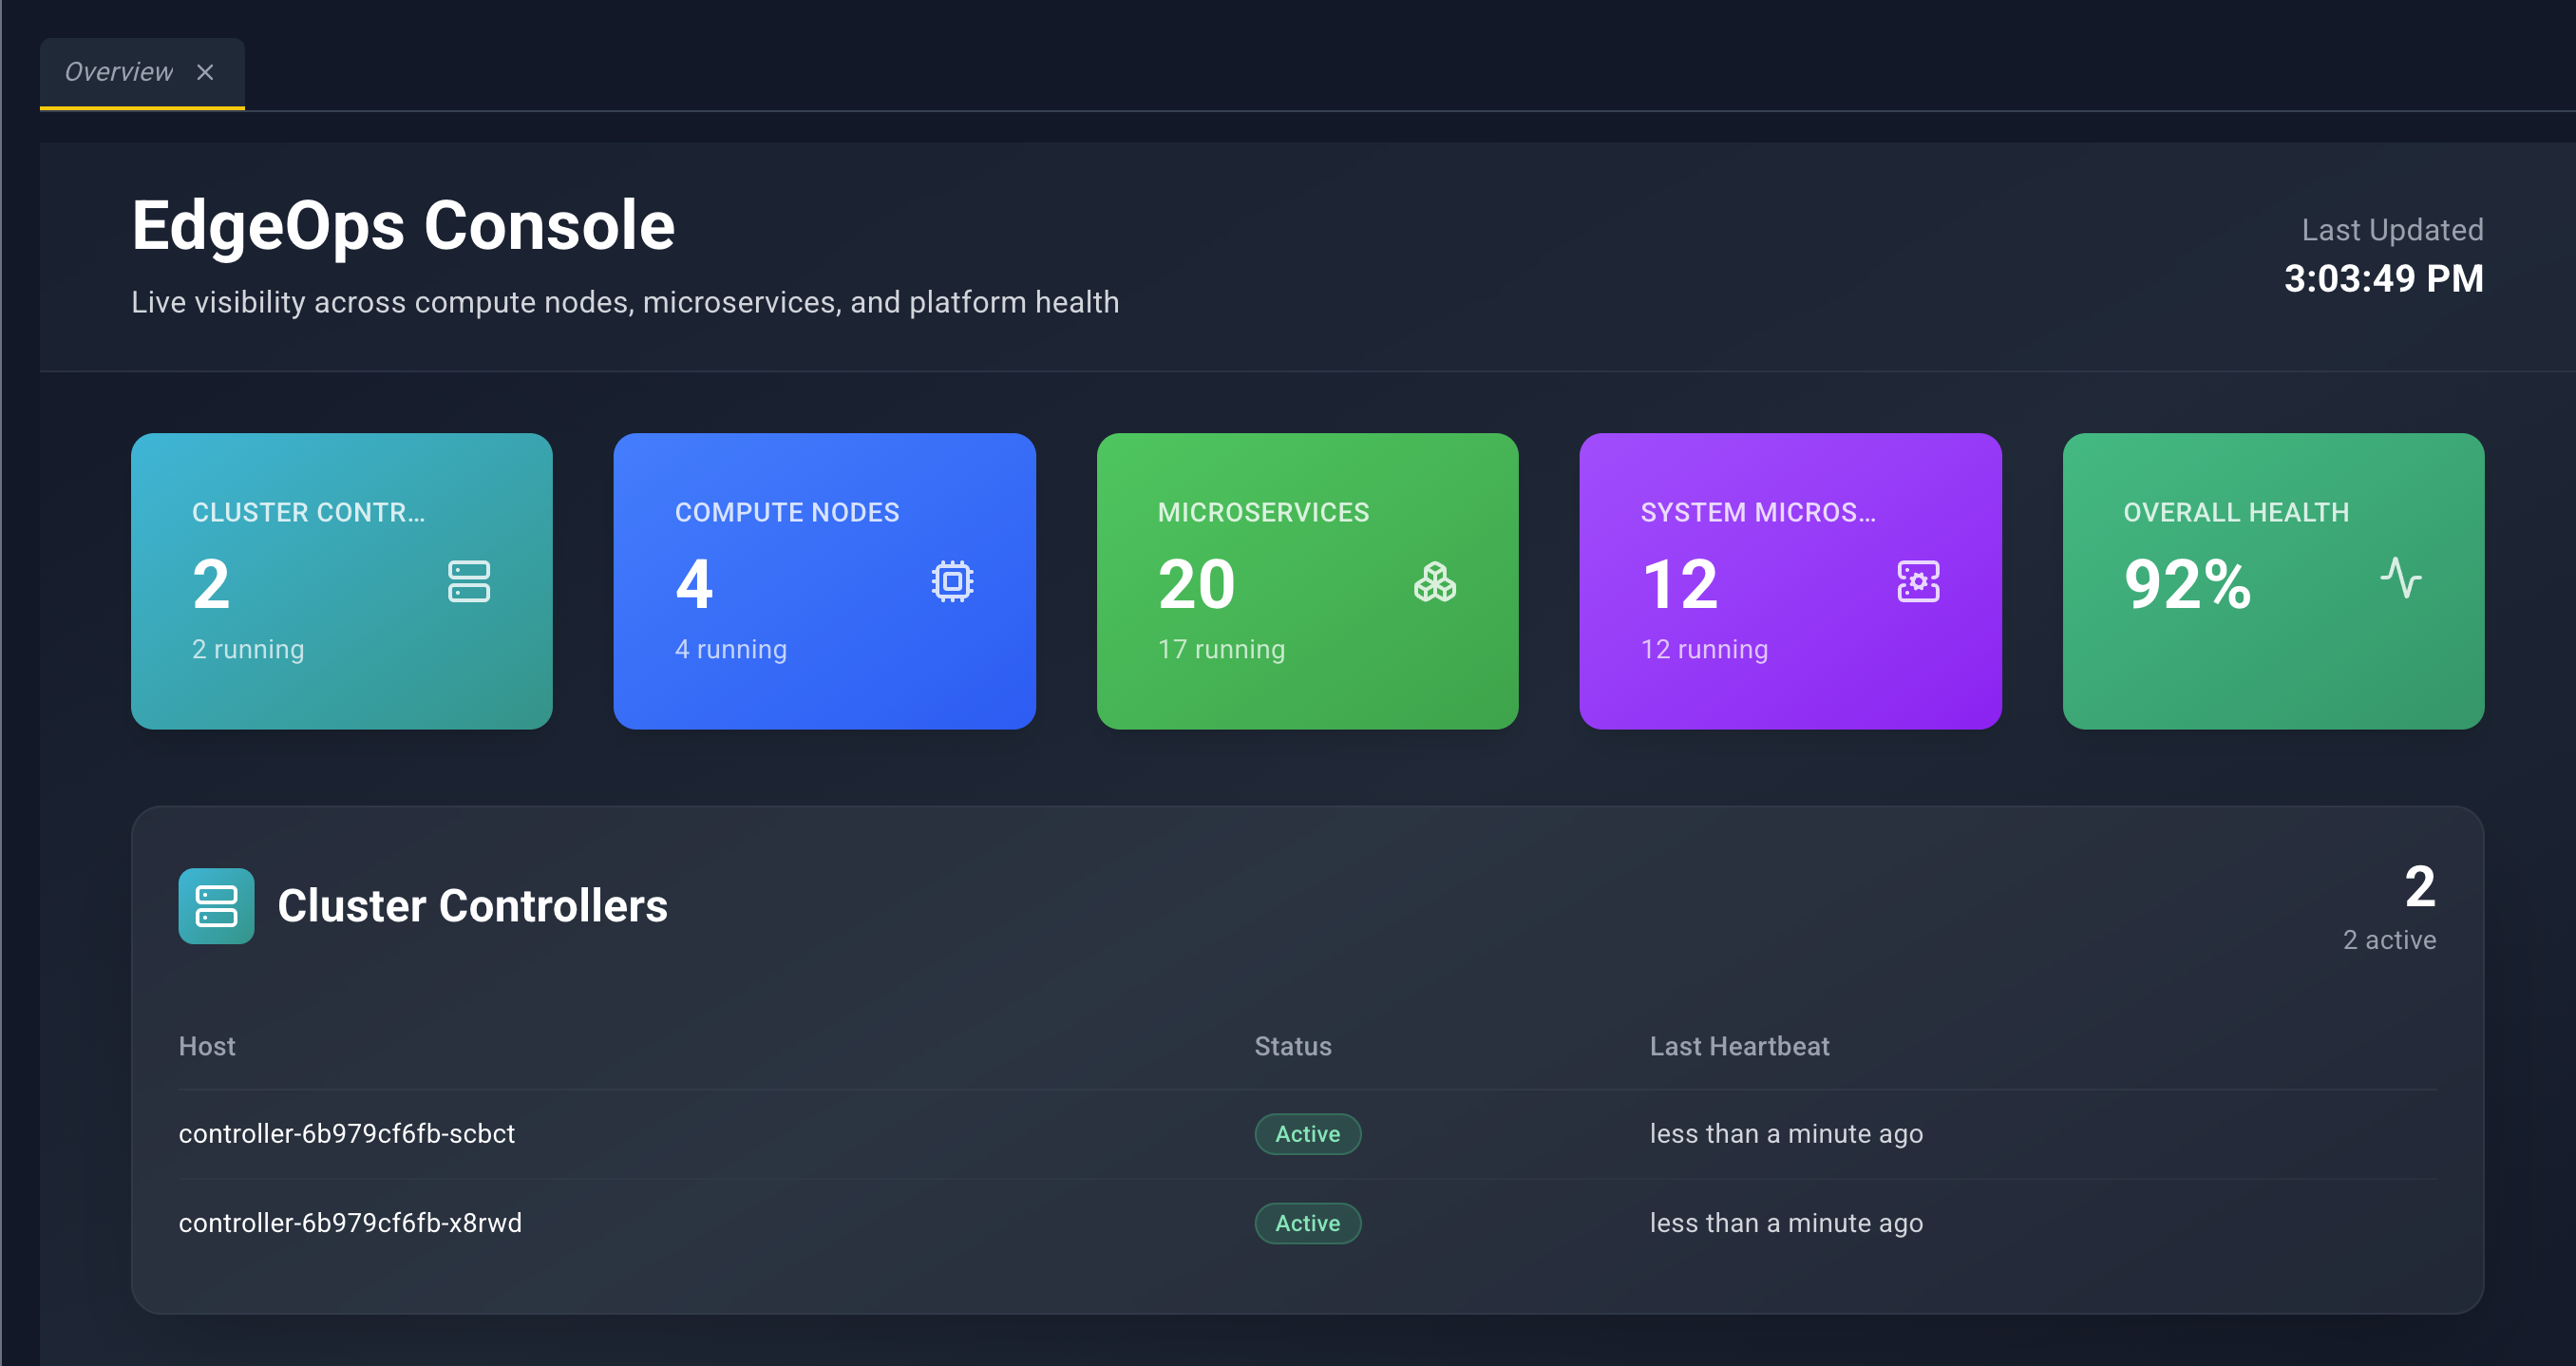
| Card | What the large number is | Secondary line |
|---|---|---|
| Cluster Controllers | How many controllers are reported | {n} running (controllers marked active). Hidden when the Controller does not send this data. |
| Compute Nodes | Edgelet nodes known to the console | {n} running (daemon status Running) |
| Microservices | Microservices on user applications | {n} running |
| System Microservices | Microservices on system applications | {n} running |
| Overall Health | Percent of those three groups that are running | No secondary count |
Overall Health is running Edgelet nodes, plus running user microservices, plus running system microservices, divided by the totals of those three groups.
Cluster controllers
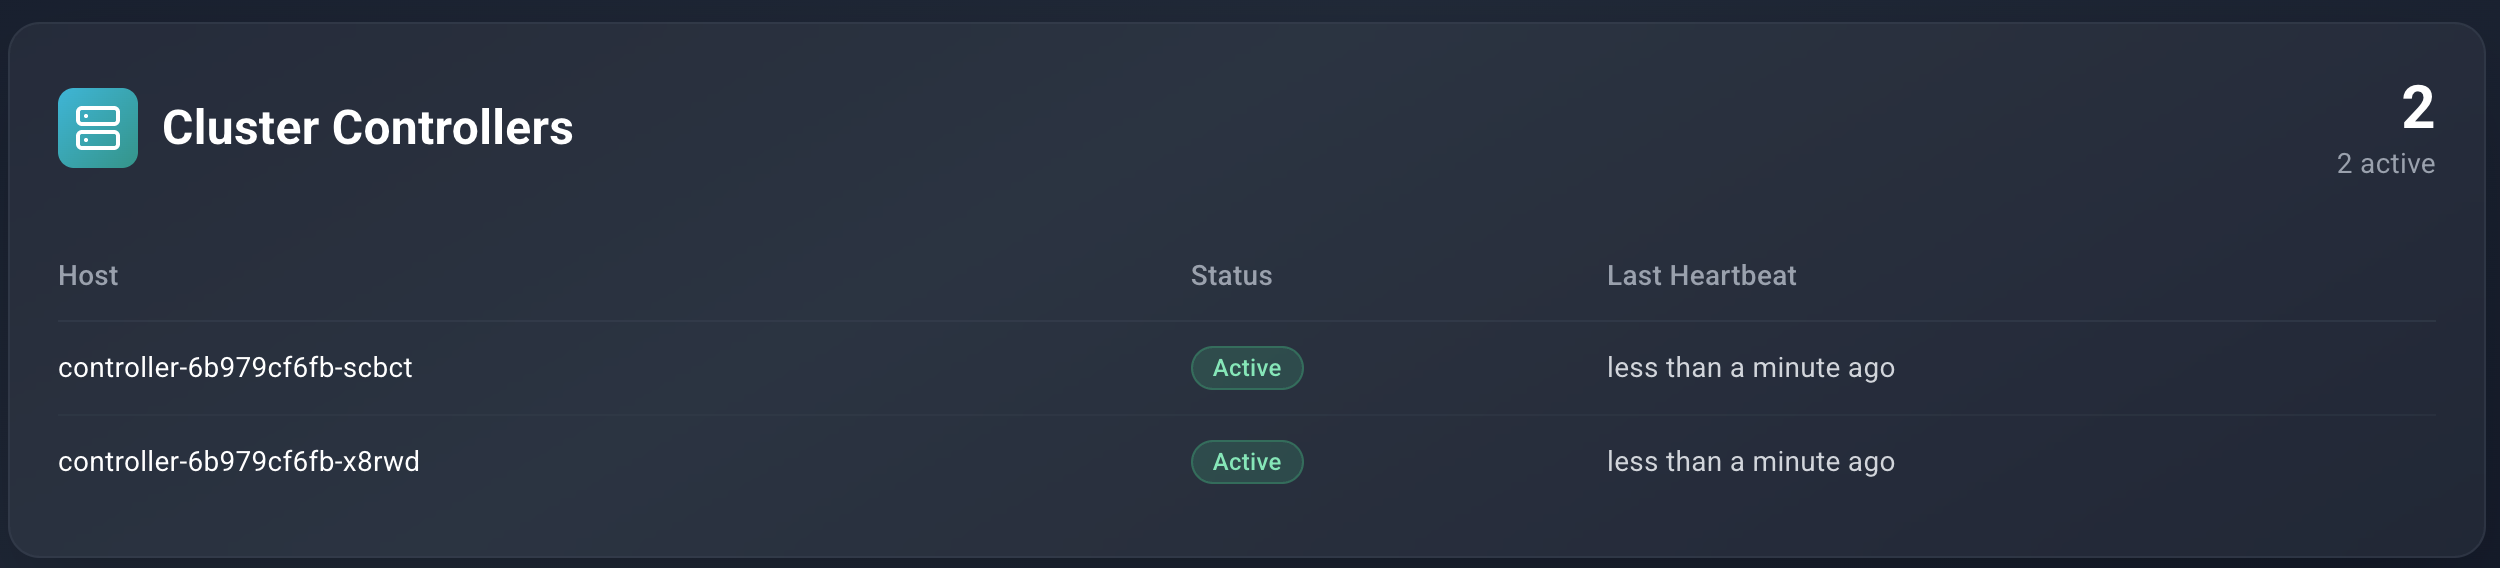
Shown only when controller status is present. Each controller is marked Active, Standby, or Stale, with heartbeat information. This section is a status view. It does not open a detail panel.
Compute nodes
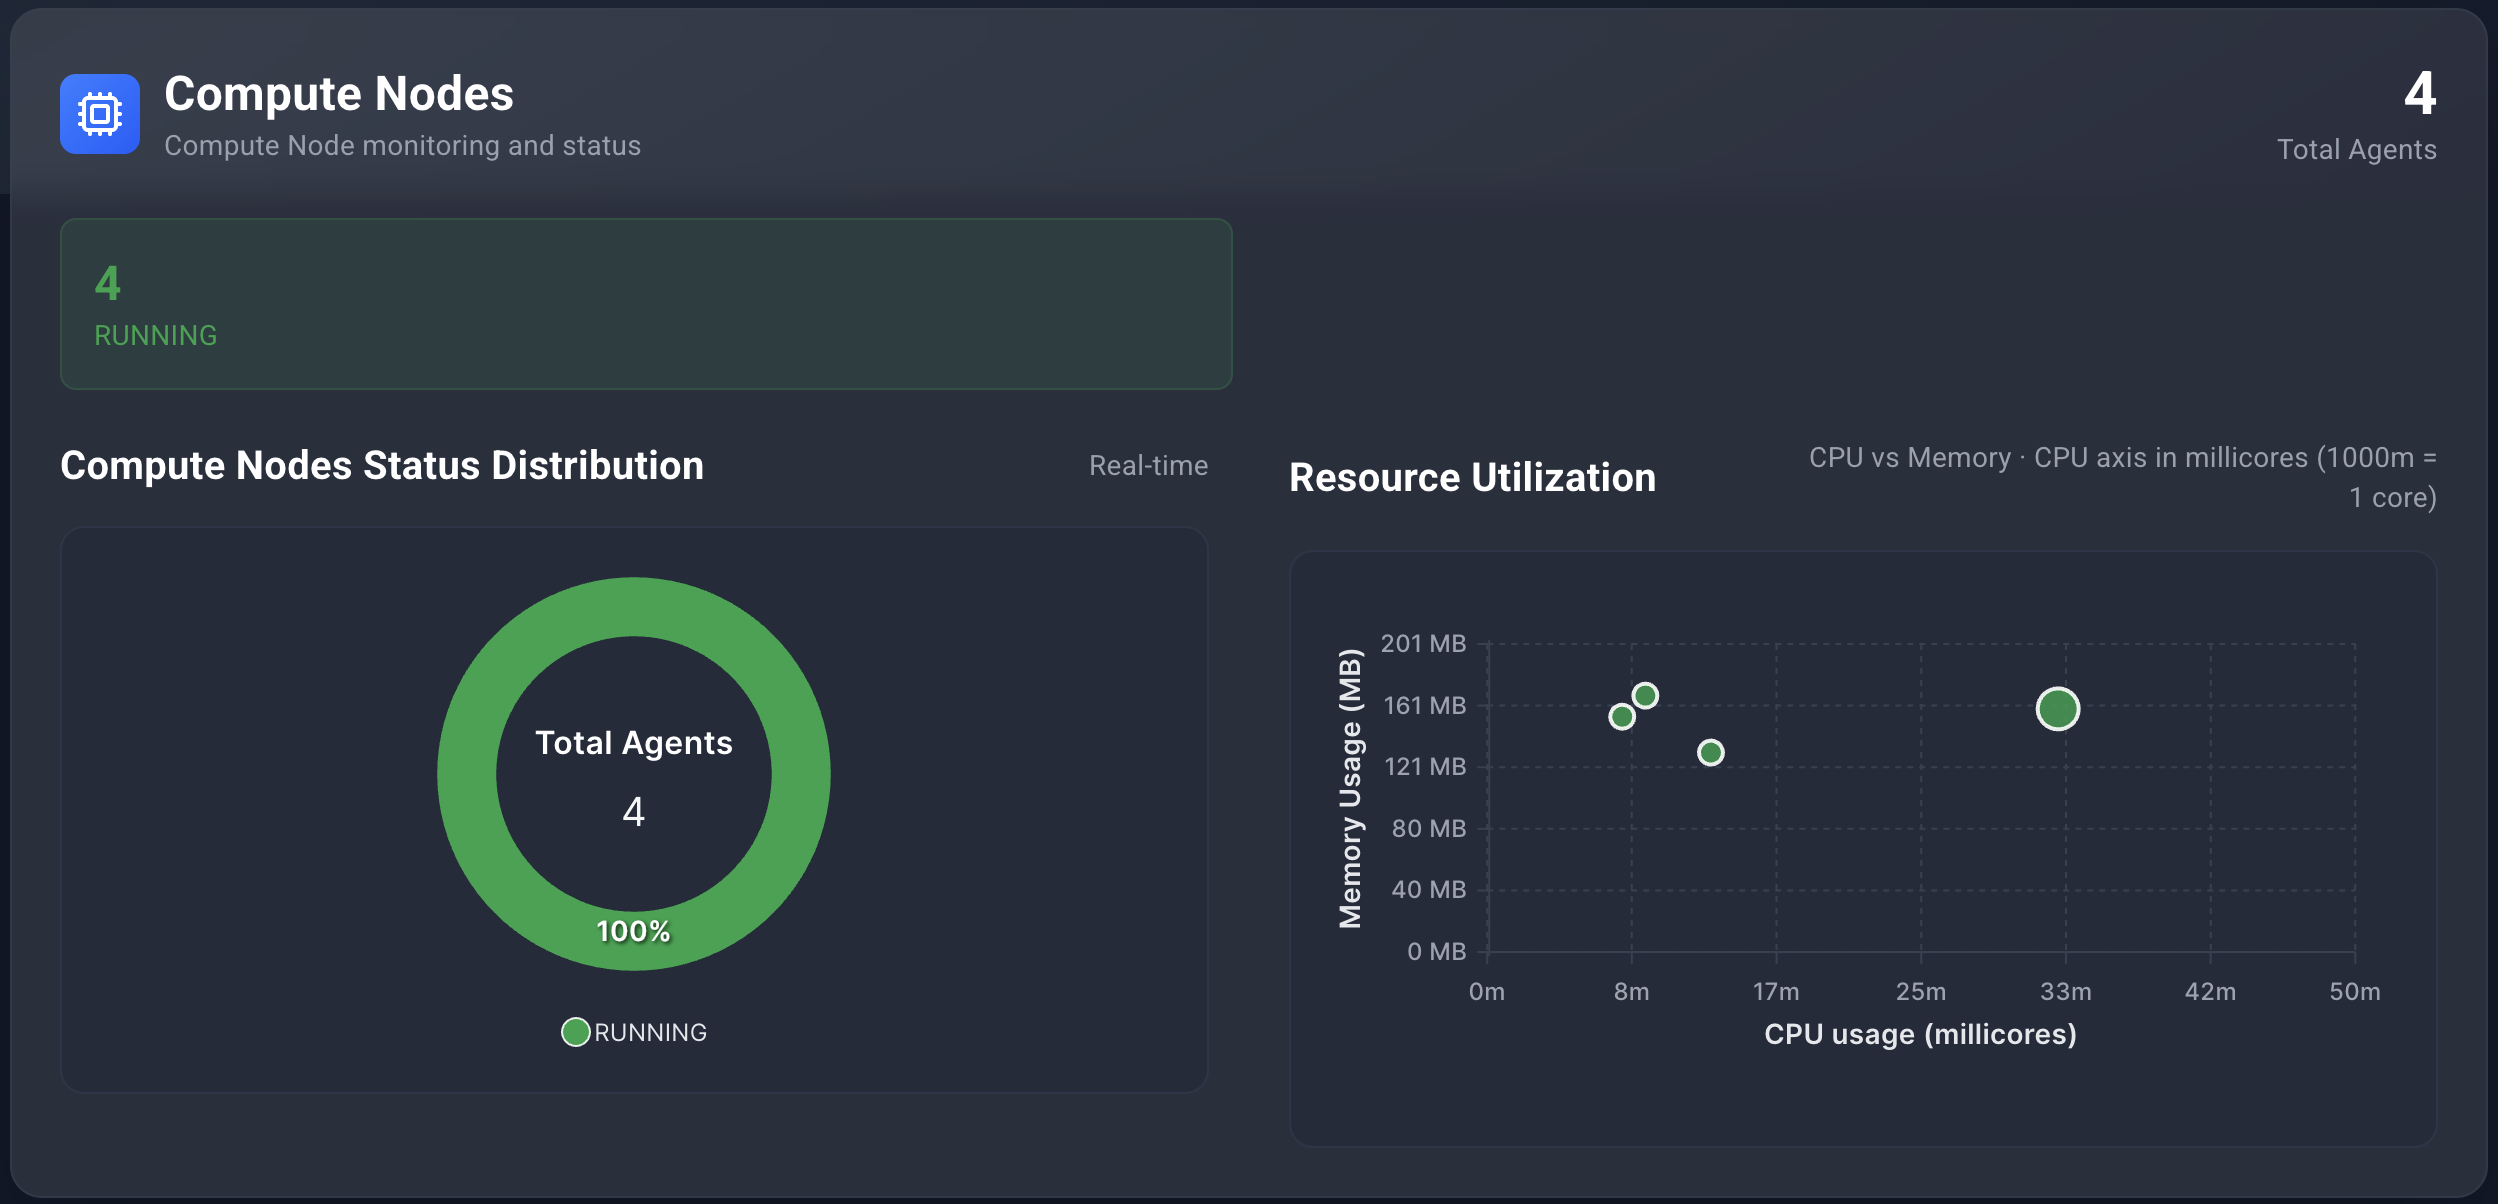
Section title Compute Nodes, subtitle Compute Node monitoring and status. A Total Agents count sits with the section.
- Status chips count Edgelet nodes in each daemon status.
- Compute Nodes Status Distribution is a donut. The center repeats Total Agents. The legend is the status names.
- Resource Utilization is a bubble chart. Horizontal position is CPU usage in millicores. Vertical position is memory usage in megabytes. Hover a bubble for the Edgelet node name, status, CPU, memory, and disk.
If the cluster has no Edgelet nodes, the section says No agents found.
Microservices
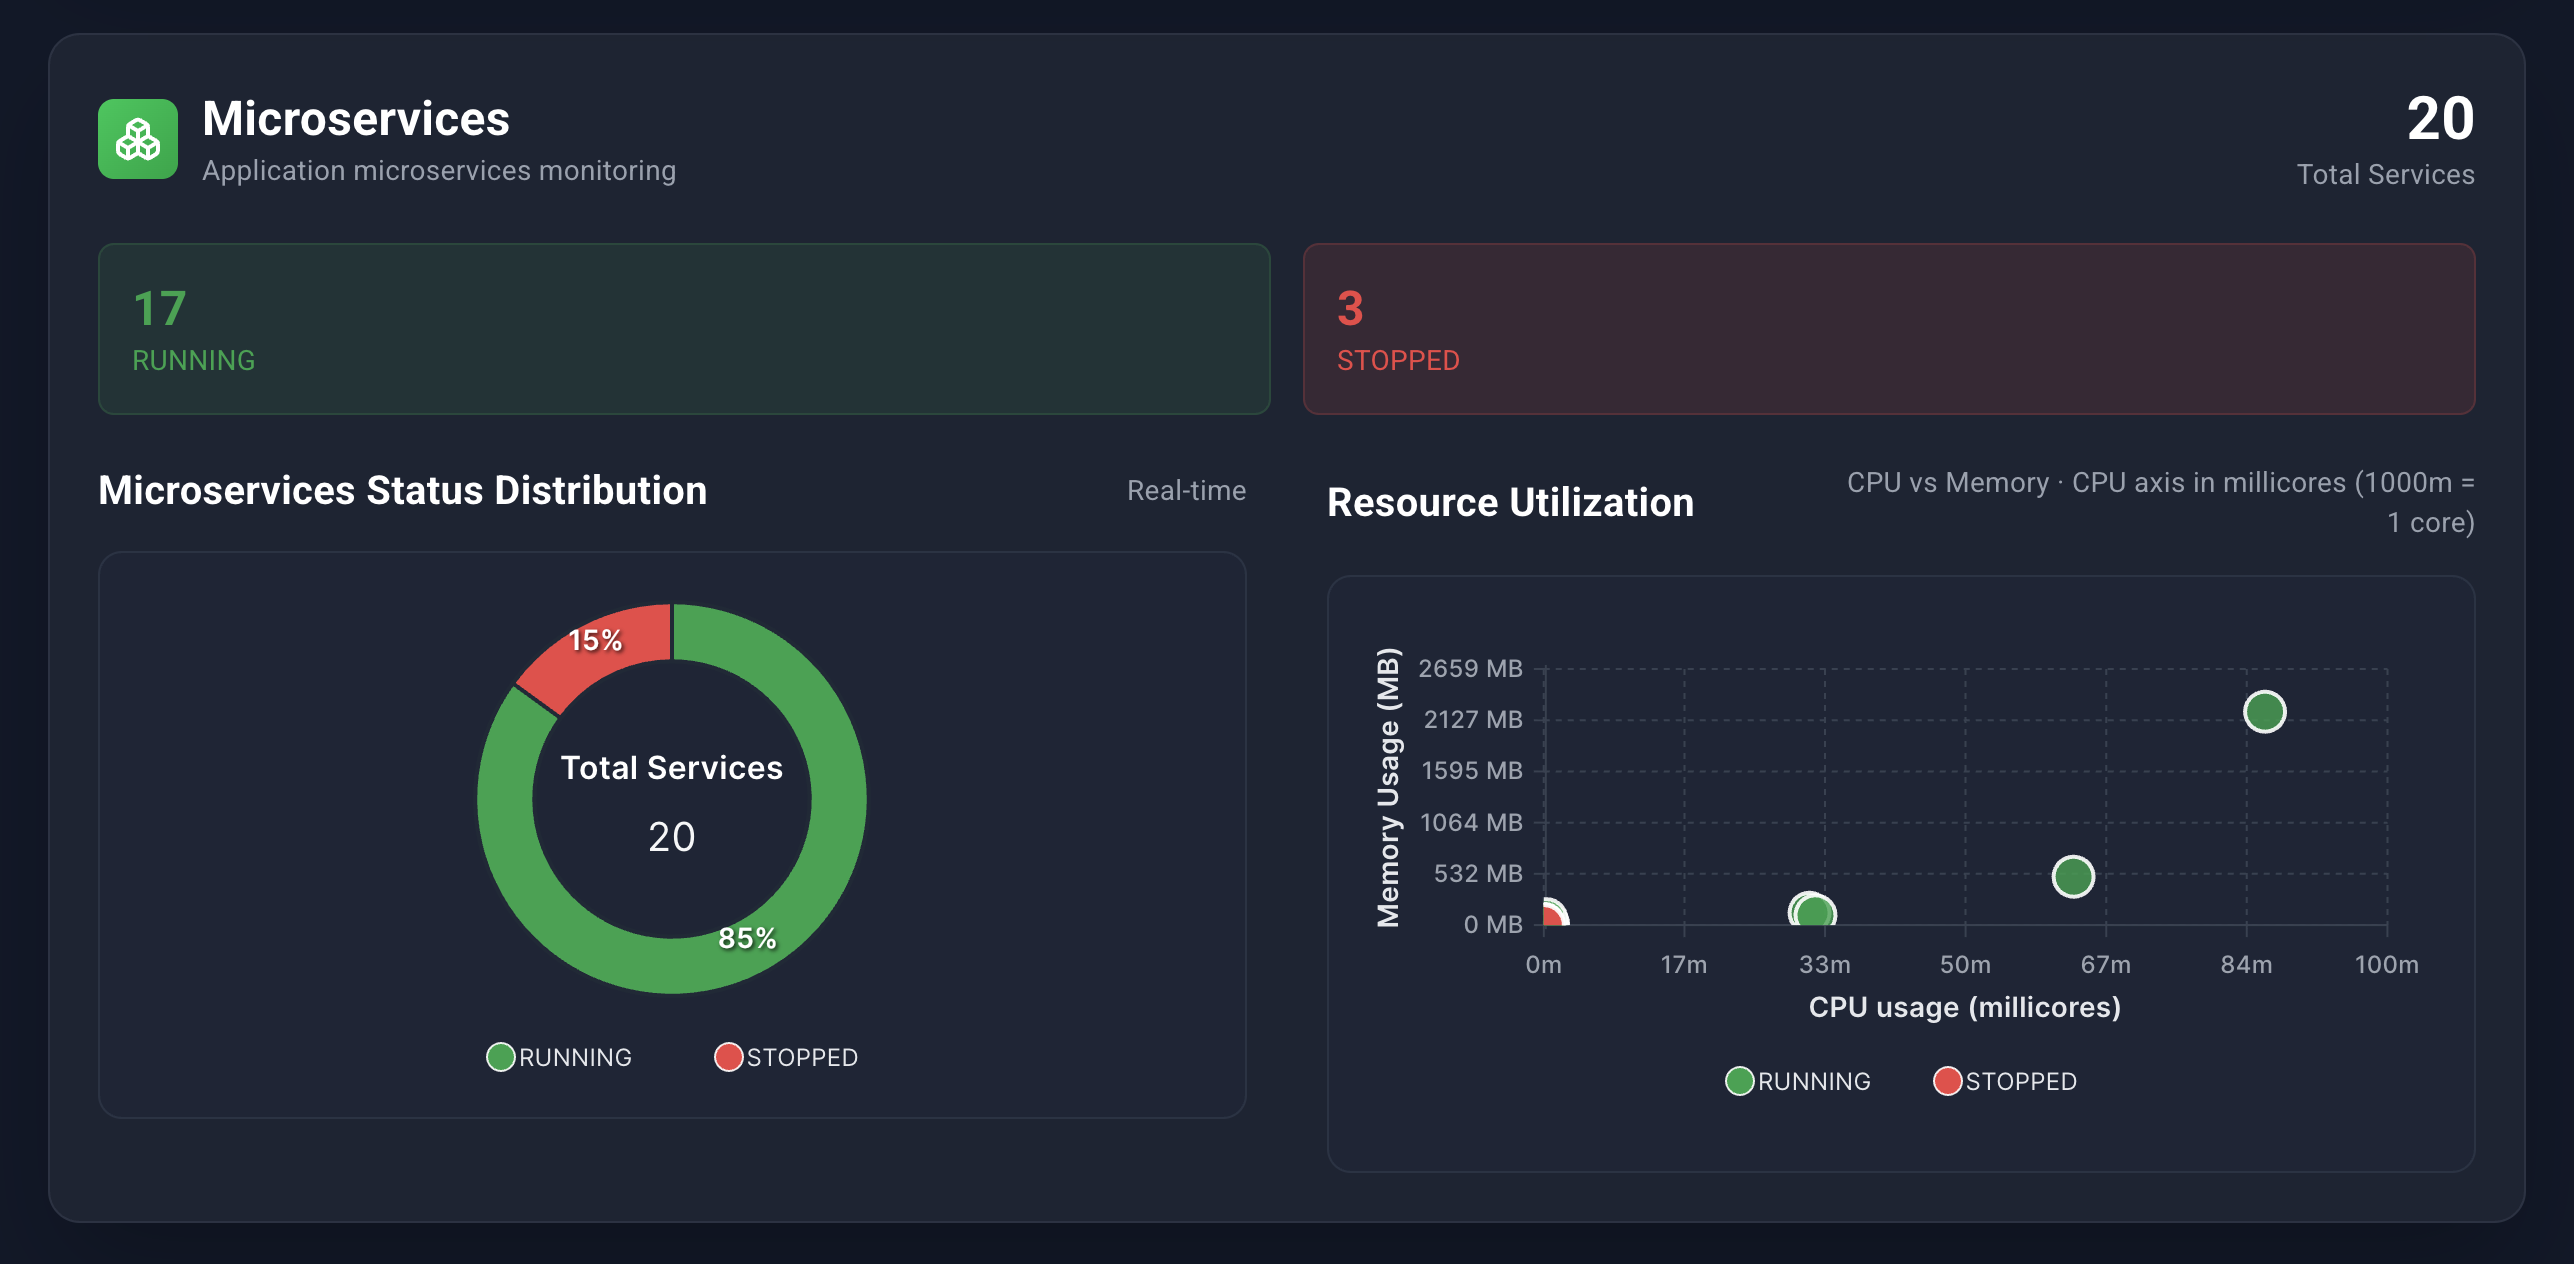
The user-microservice section uses the same two charts. The donut center says Total Services. The subtitle is Application microservices monitoring. A bubble tooltip includes Application and Edge Node plus CPU and memory.
Empty copy: No microservices found / No microservice data is currently available.
System microservices
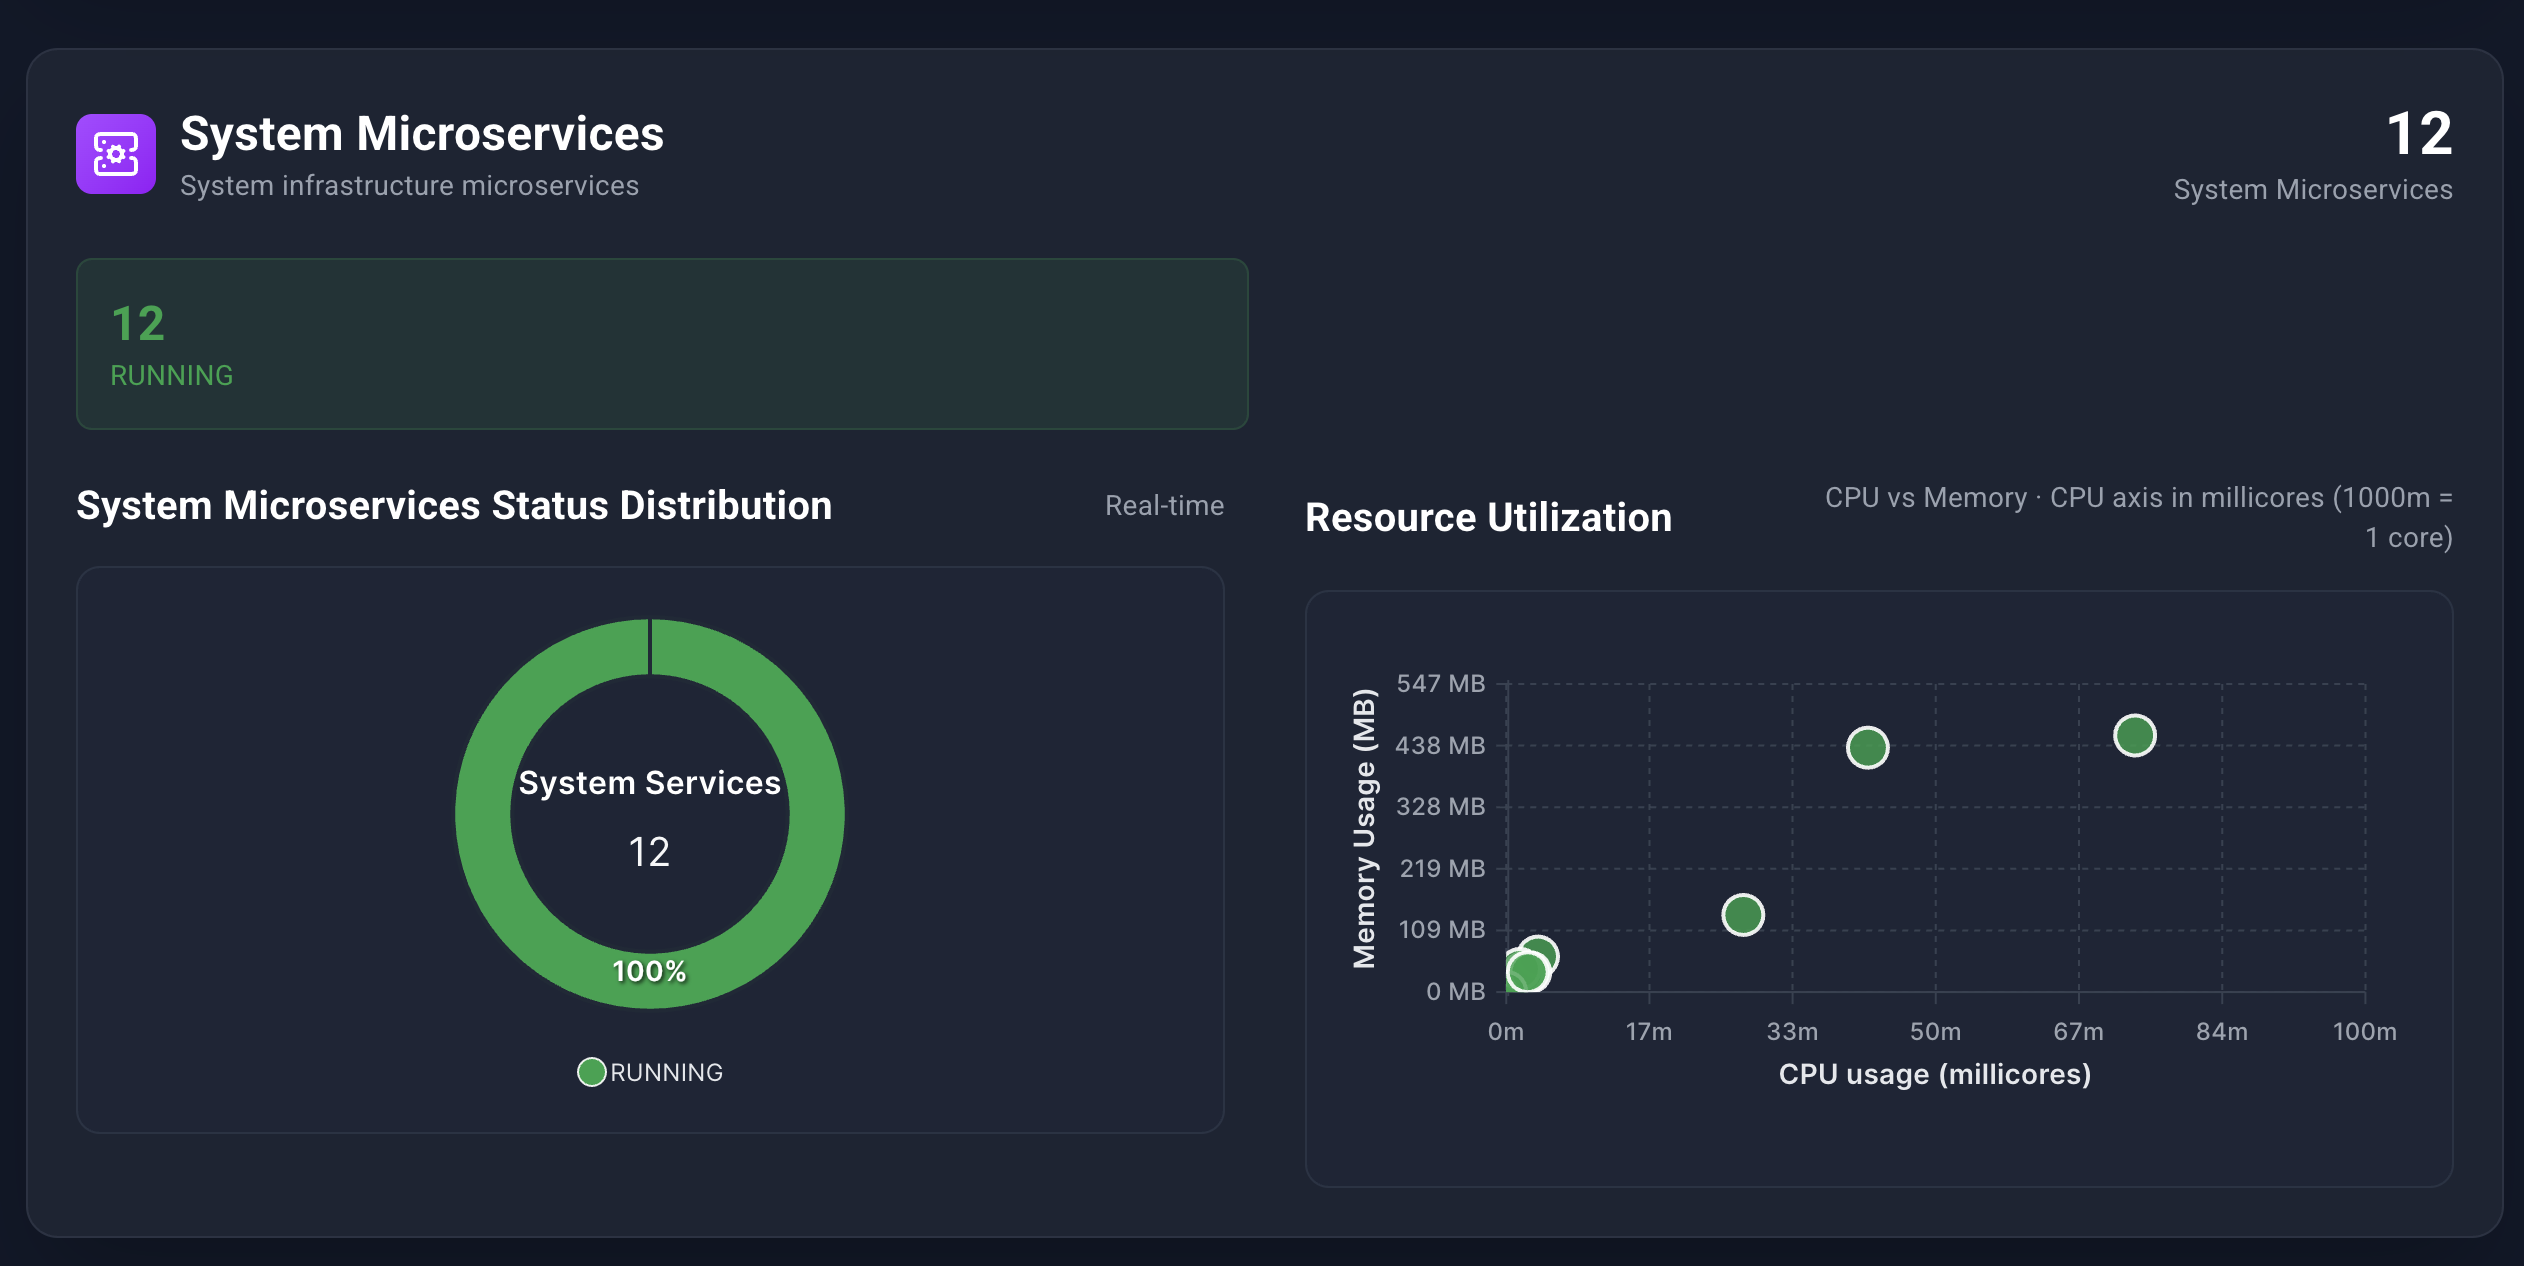
Same layout as the user microservice charts, for system workloads. Empty copy: No system microservices found.
Lists for these resources live under Workloads and Nodes. Overview does not deep-link into them.