Alert dashboard service
Goal
Create kind: Service for the dashboard. alert-dashboard is already deployed on ops-b and listens on external port 8082.
The file is deploy/steps/07-service-alert-dashboard.yaml.
YAML
apiVersion: datasance.com/v3
kind: Service
metadata:
  name: alert-dashboard
  tags:
    - pot-edge-patterns
spec:
  type: microservice
  resource: operations-center/alert-dashboard
  targetPort: 8082
  defaultBridge: default-router
For a lab browser that cannot use Router DNS, you can also set ports.external on the alert-dashboard microservice so the node IP serves the UI. The Router URL is the path this example uses.
Deploy
potctl deploy -f deploy/steps/07-service-alert-dashboard.yaml
What you should see
potctl describe service alert-dashboard
Open http://router.default.svc.bridge.local:<dashboard-bridge-port>/ with that bridgePort.
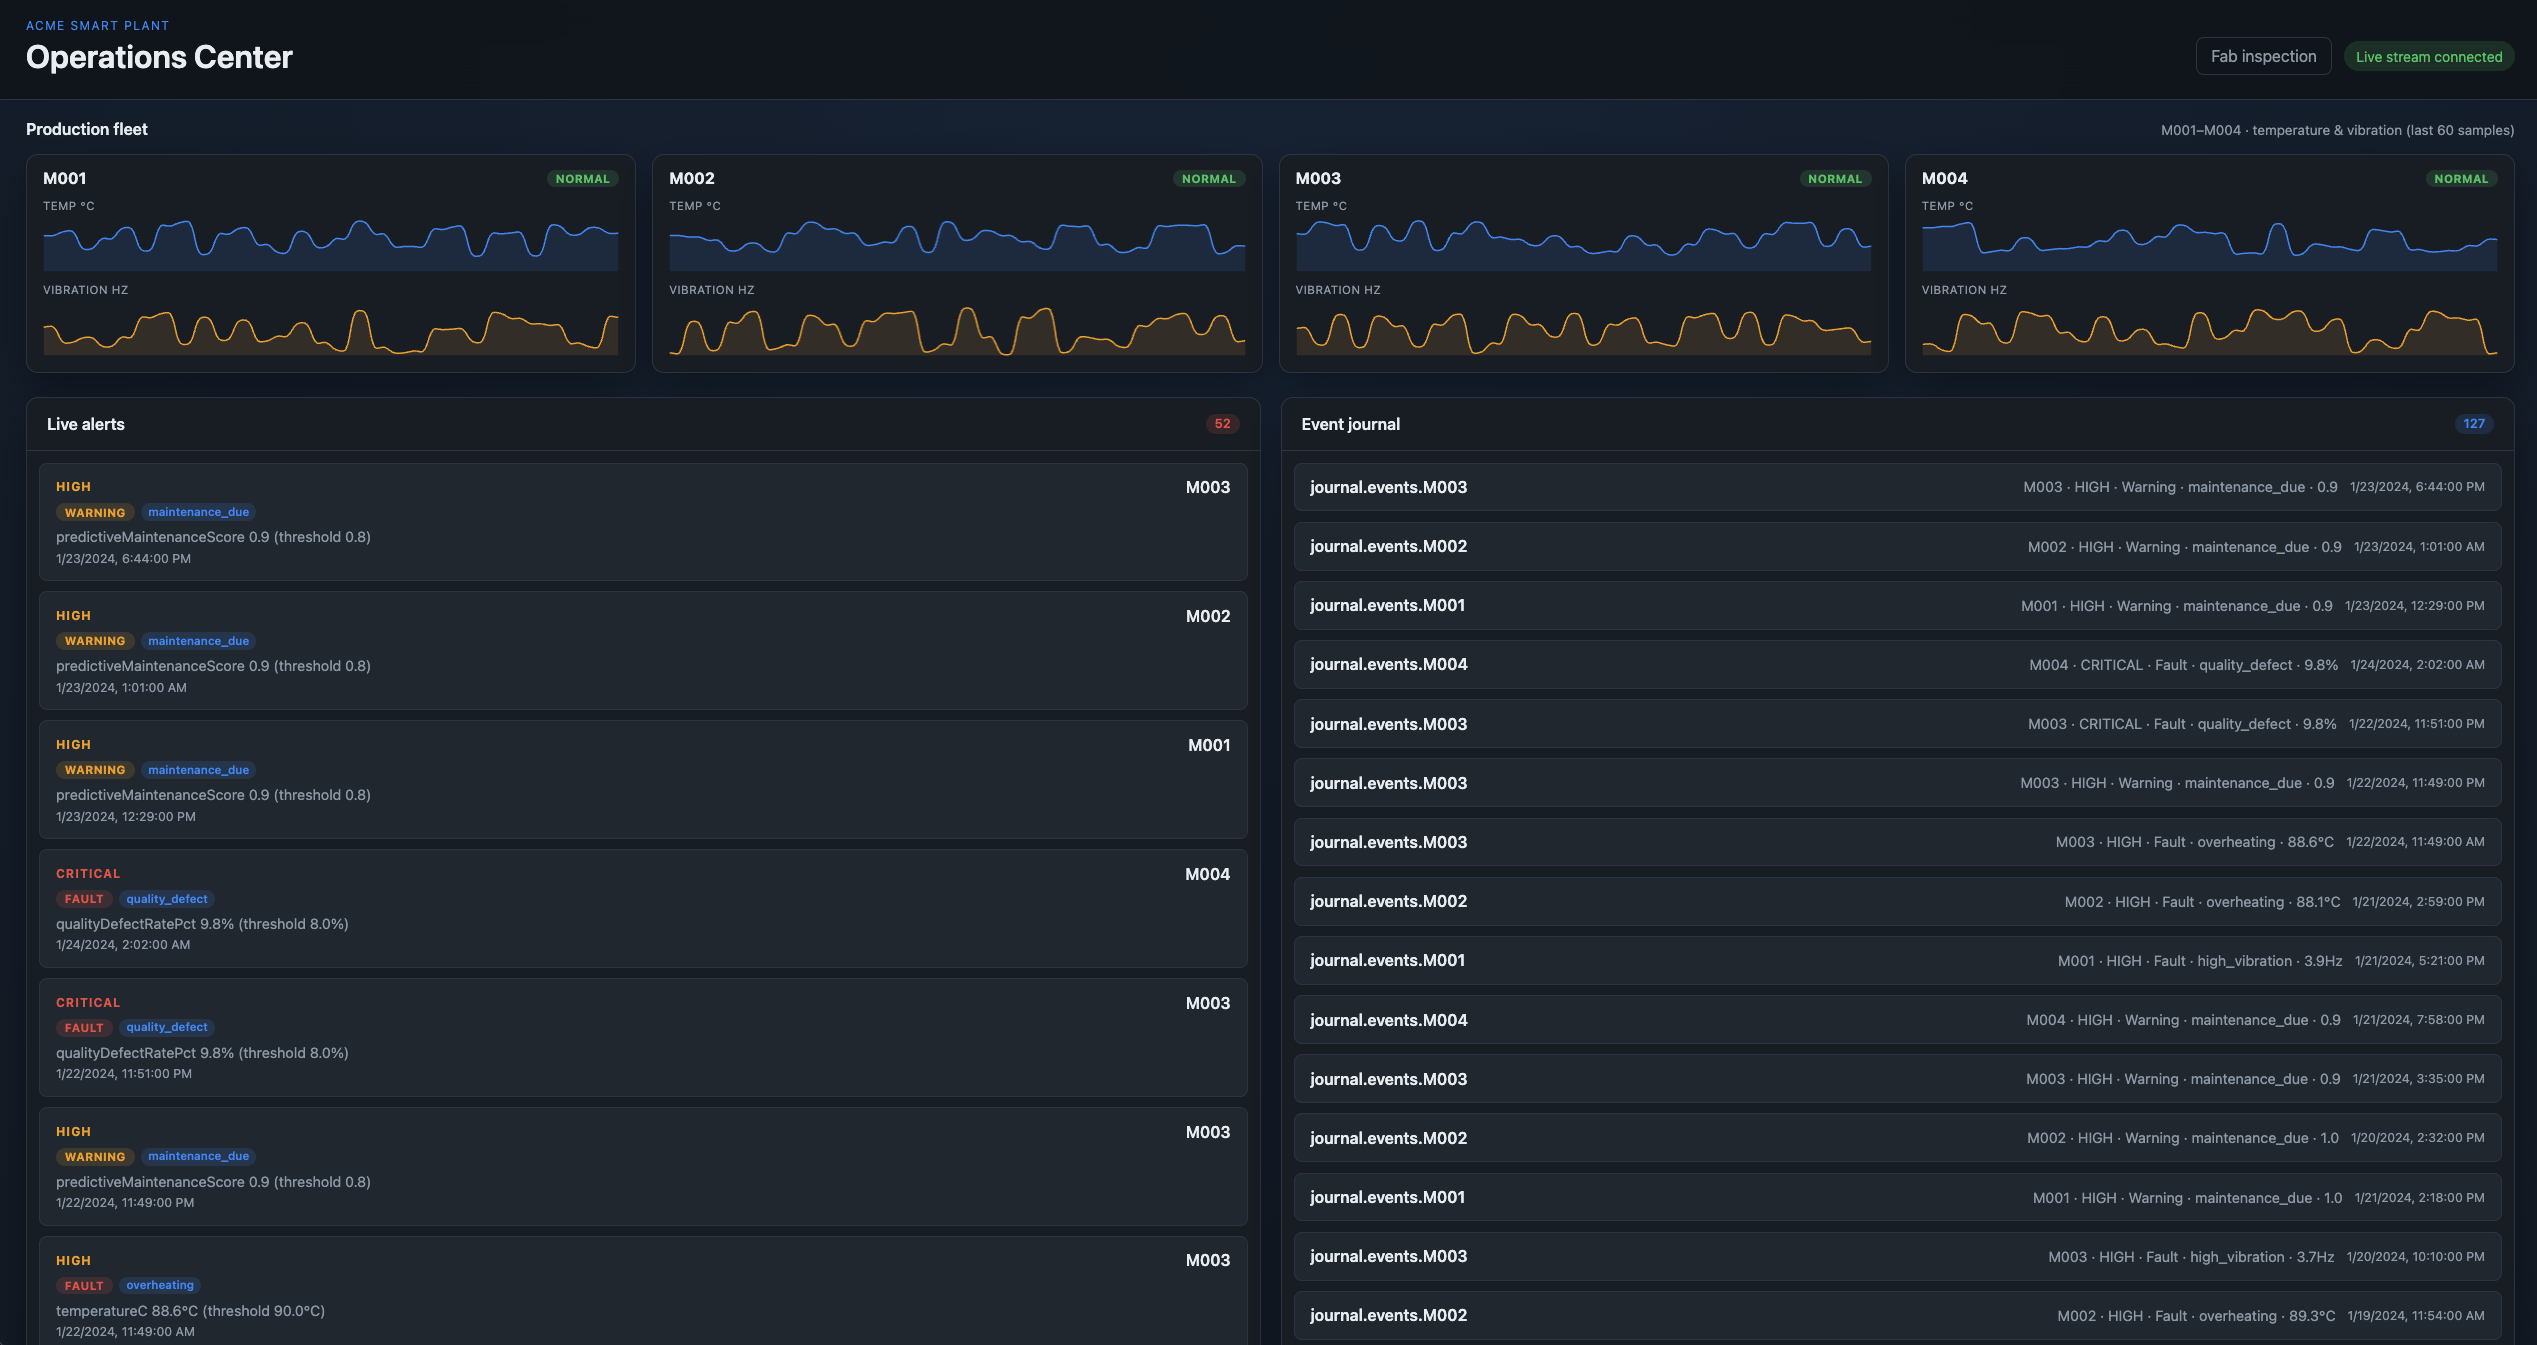
- Fleet charts update for M001 through M004.
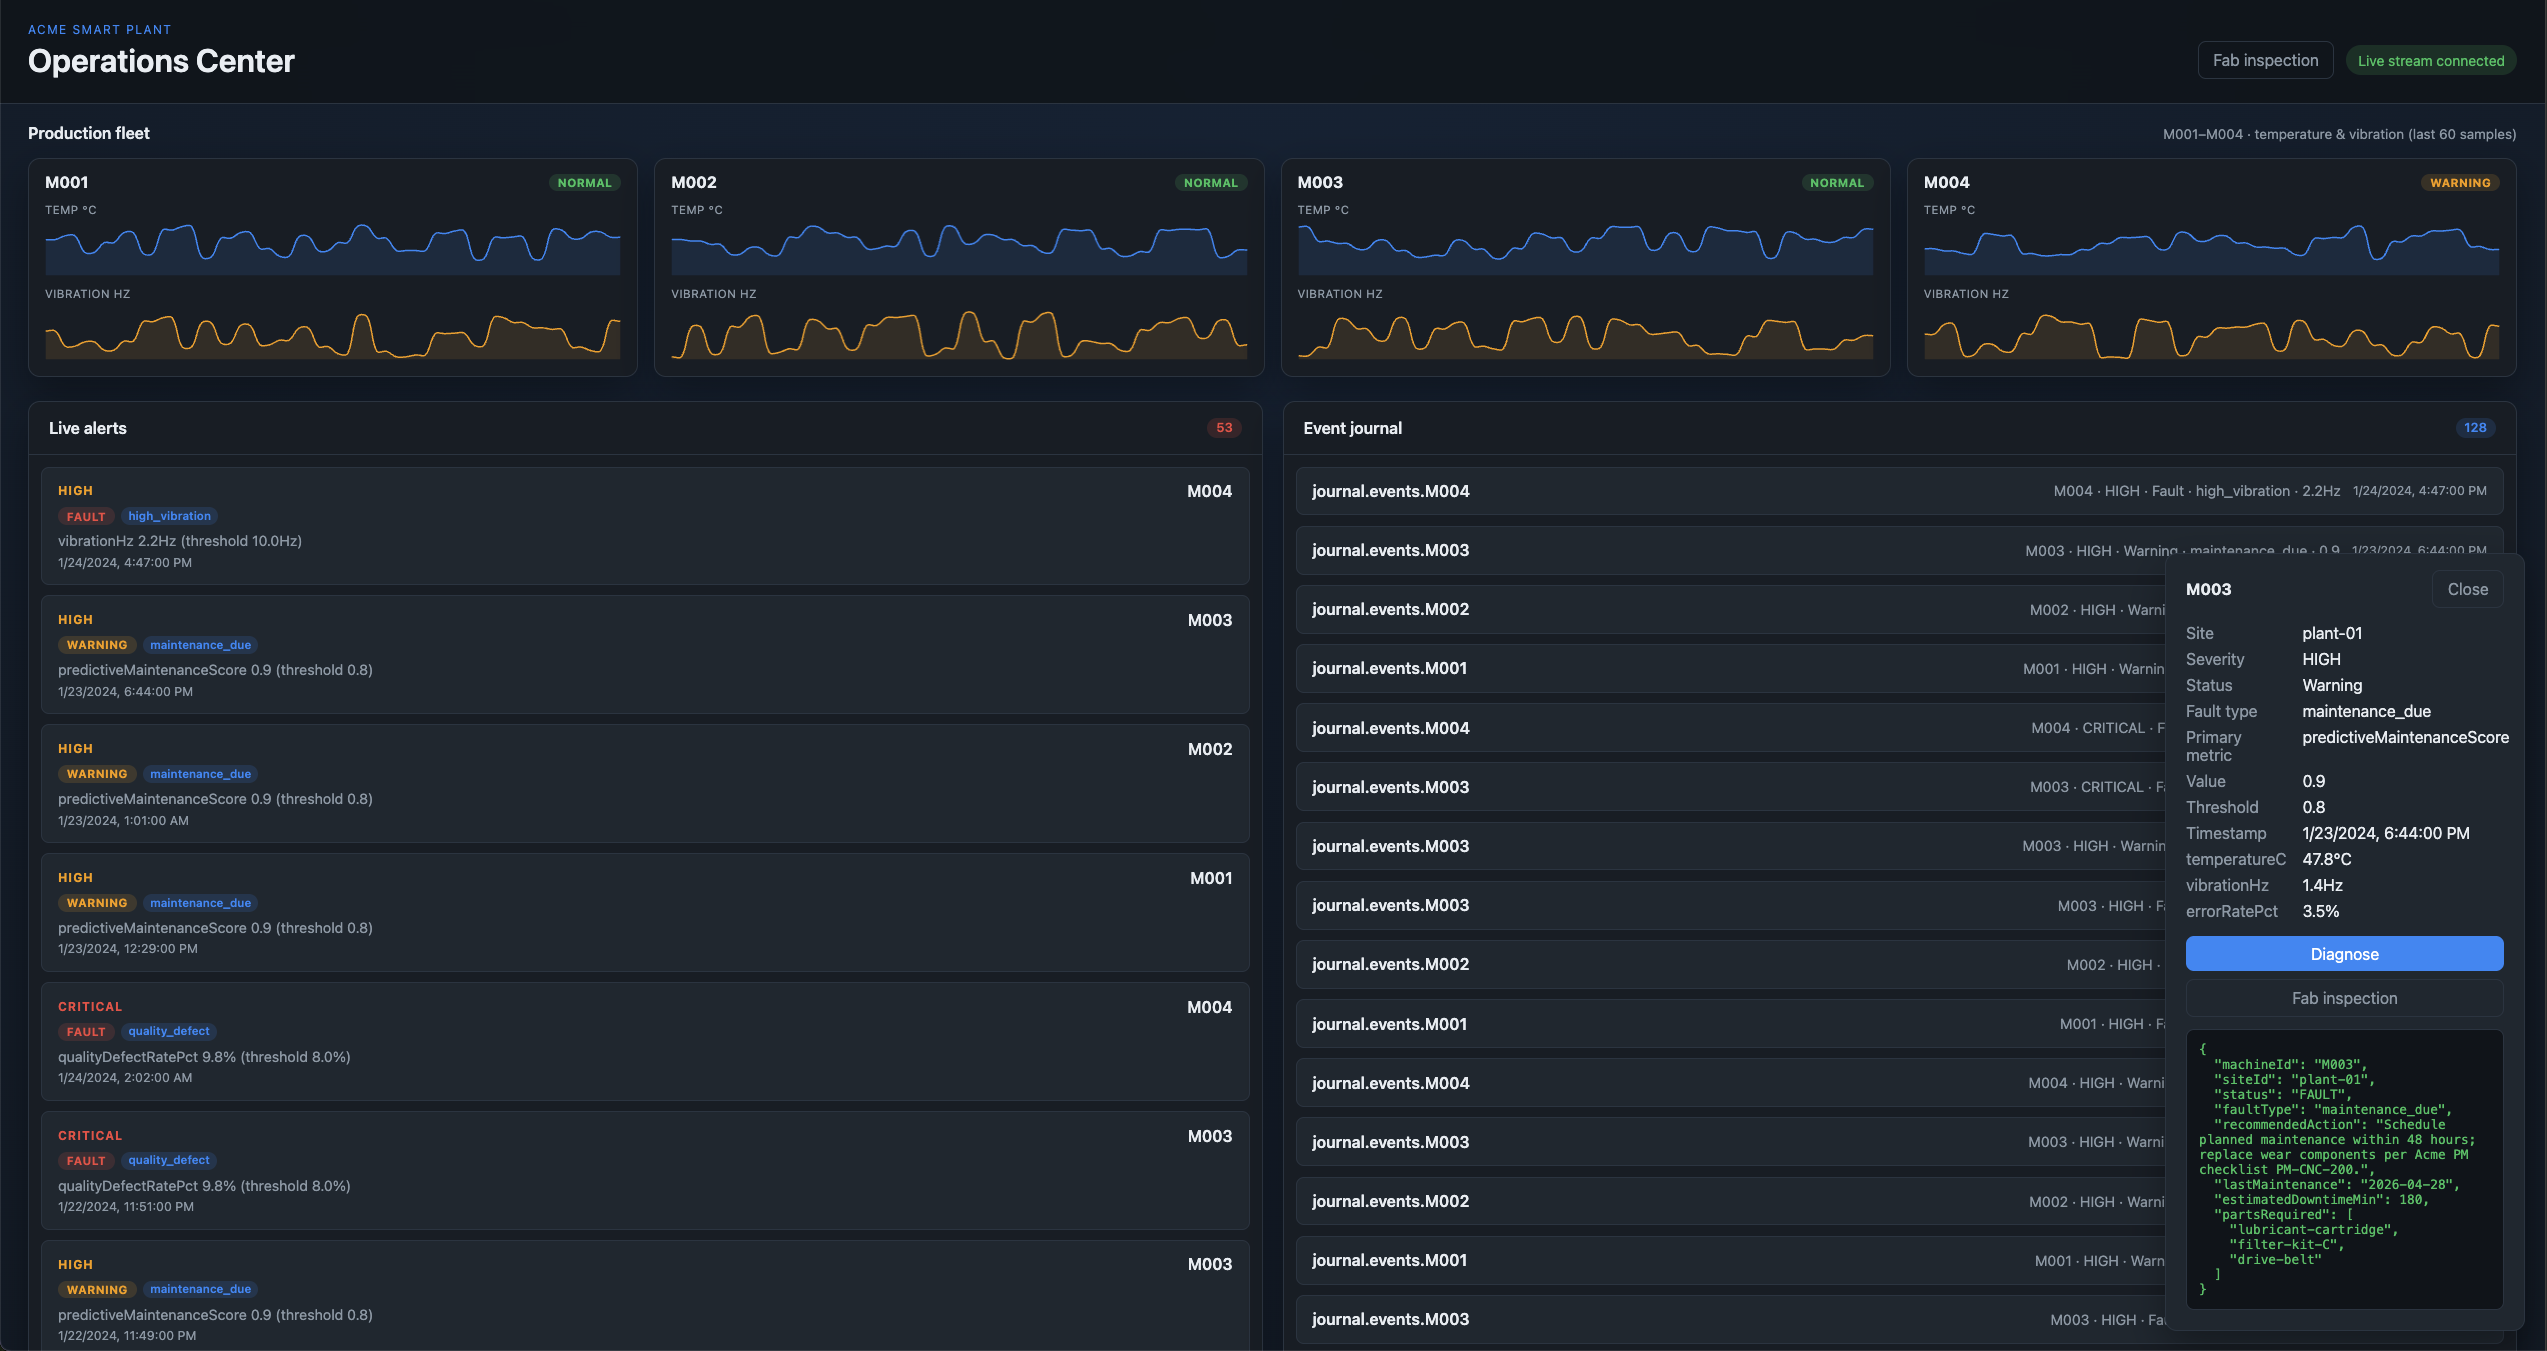
- A fault in the replay shows on the live alert panel, and the journal still shows it after refresh.
- Diagnose returns JSON through
DIAGNOSTIC_URL.
potctl describe microservice sensor-simulator
Sensor logs show four machines publishing on telemetry.machine..
Open Alert Dasbord Dashboard unavailable
Common mistakes
Live alerts stay empty. Recheck the account id on the import rule and the ops-viewer user rule.
Fleet charts stay empty. Confirm the fleet-telemetry export and import, and TELEMETRY_SUBJECT on the dashboard.
The journal stays empty while live alerts work. Confirm the journal export and import, and detector logs for stream JOURNAL_PRODUCTION.
Diagnose returns 502. Redeploy operations center with bridgePort from the diagnostic service.
Next
The plant floor example is complete. If the wafer example is already deployed, Fab gallery link points this dashboard at the gallery.