Console features
EdgeOps Console v1.0.9 mirrors most day-2 potctl workflows in the browser. It uses the same Controller REST API and RBAC rules as the CLI. Audit events record Console actions the same way as API calls from automation.
Dashboard and fleet view
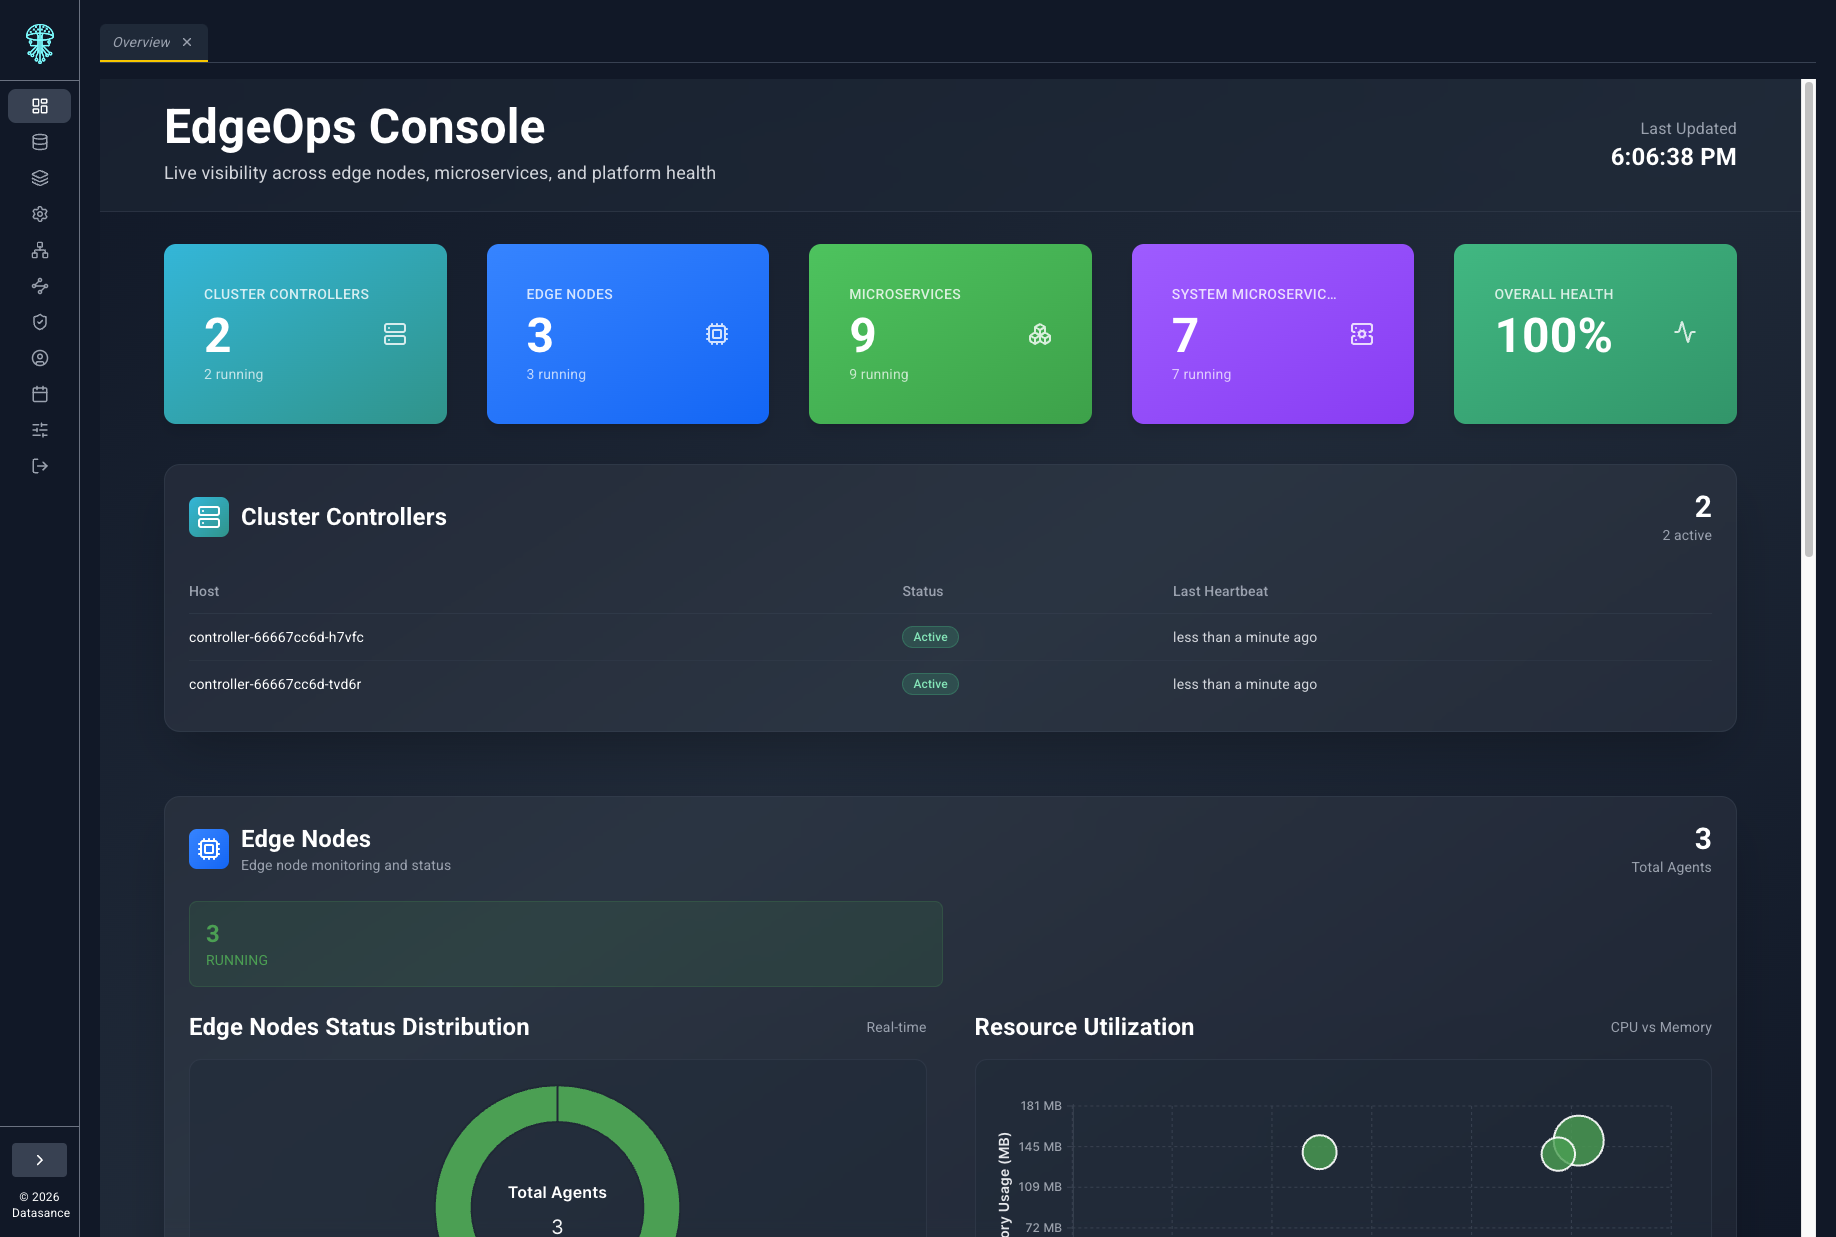
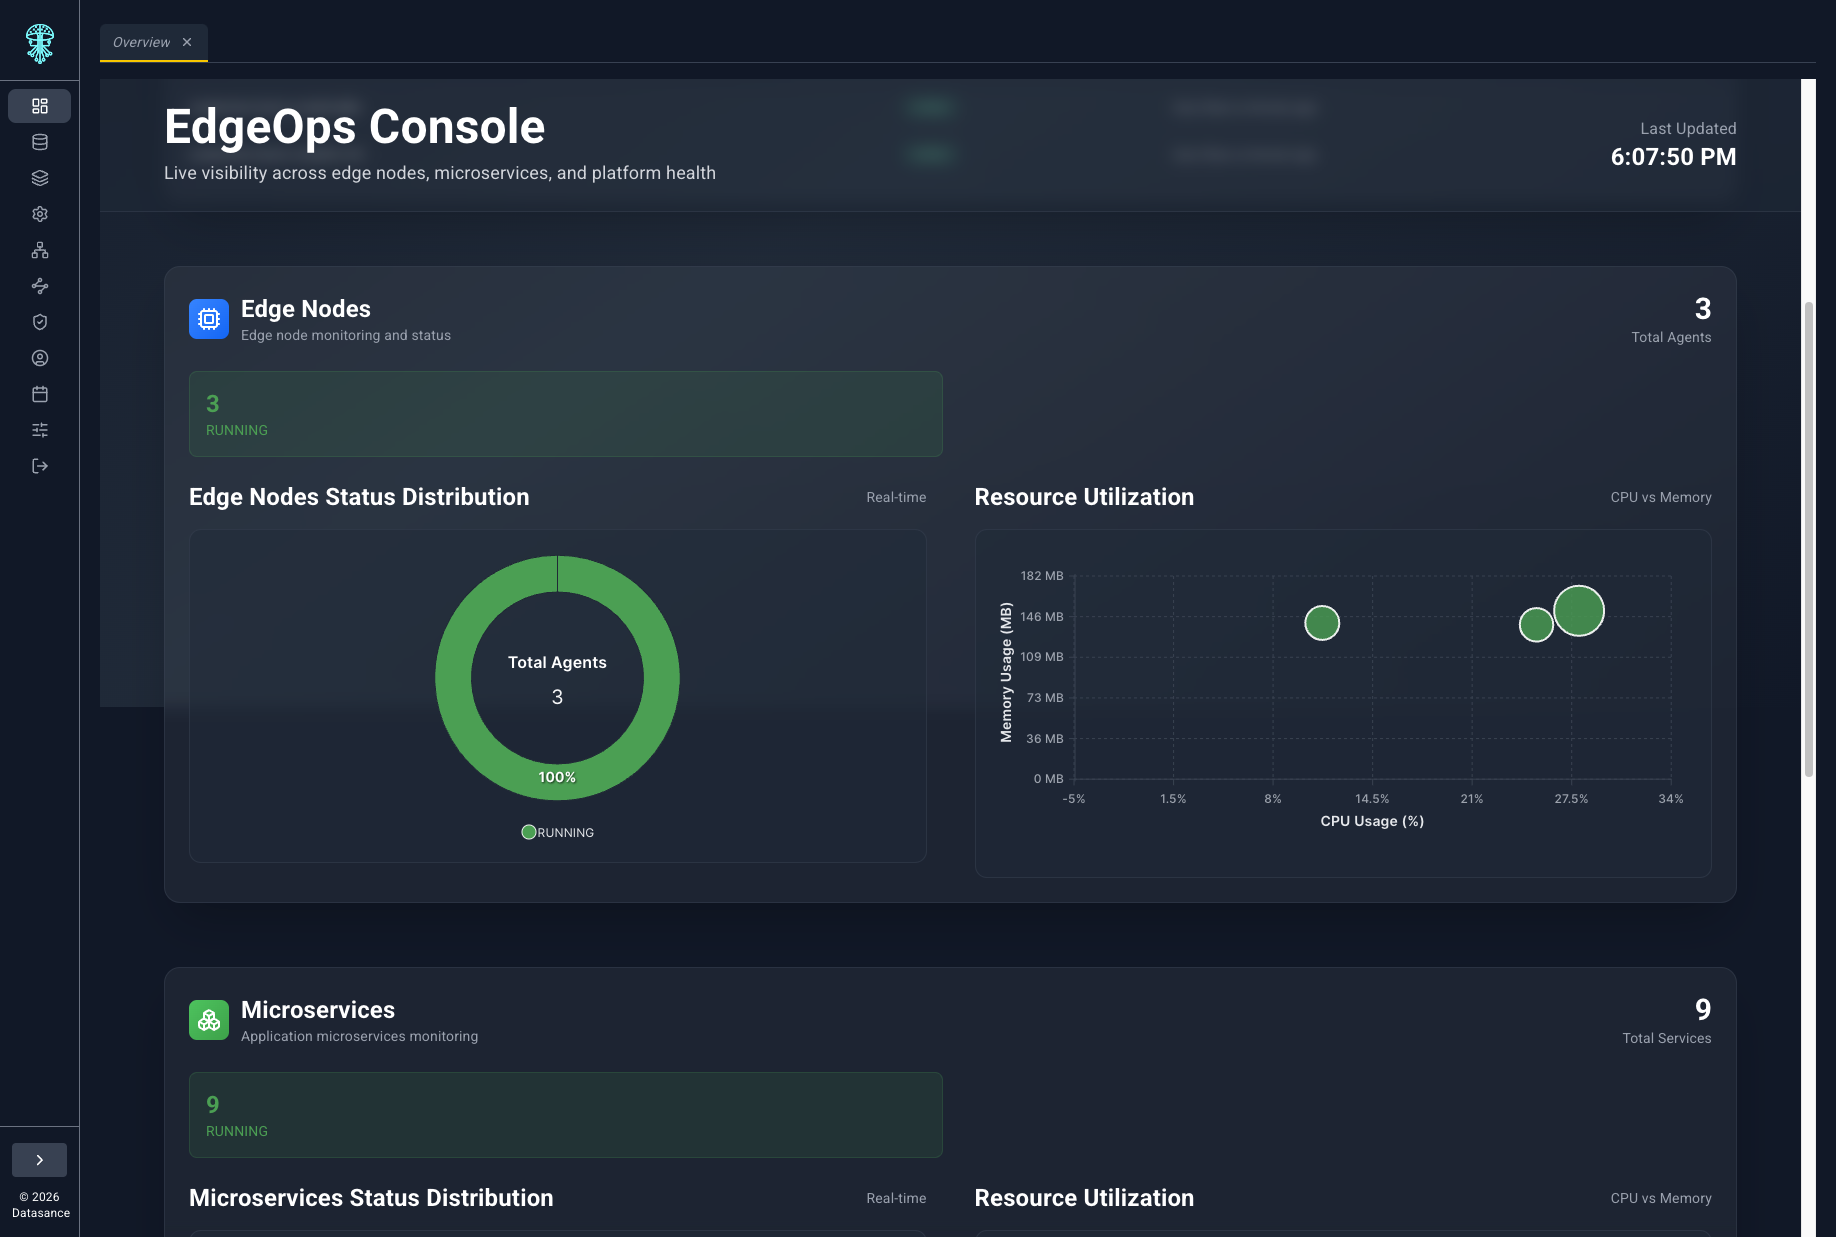
The landing view shows ECN health, capacity, alerts, and deployment activity. You can review timelines and workload density across namespaces you are allowed to access.
Edgelet nodes
The Nodes section lists every Edgelet node (kind: Agent in YAML). For each node you can inspect status, edit YAML, open a remote shell, and review platform setup.
In UI prose we say Edgelet node. YAML and API fields still use Agent.
Fleet inventory
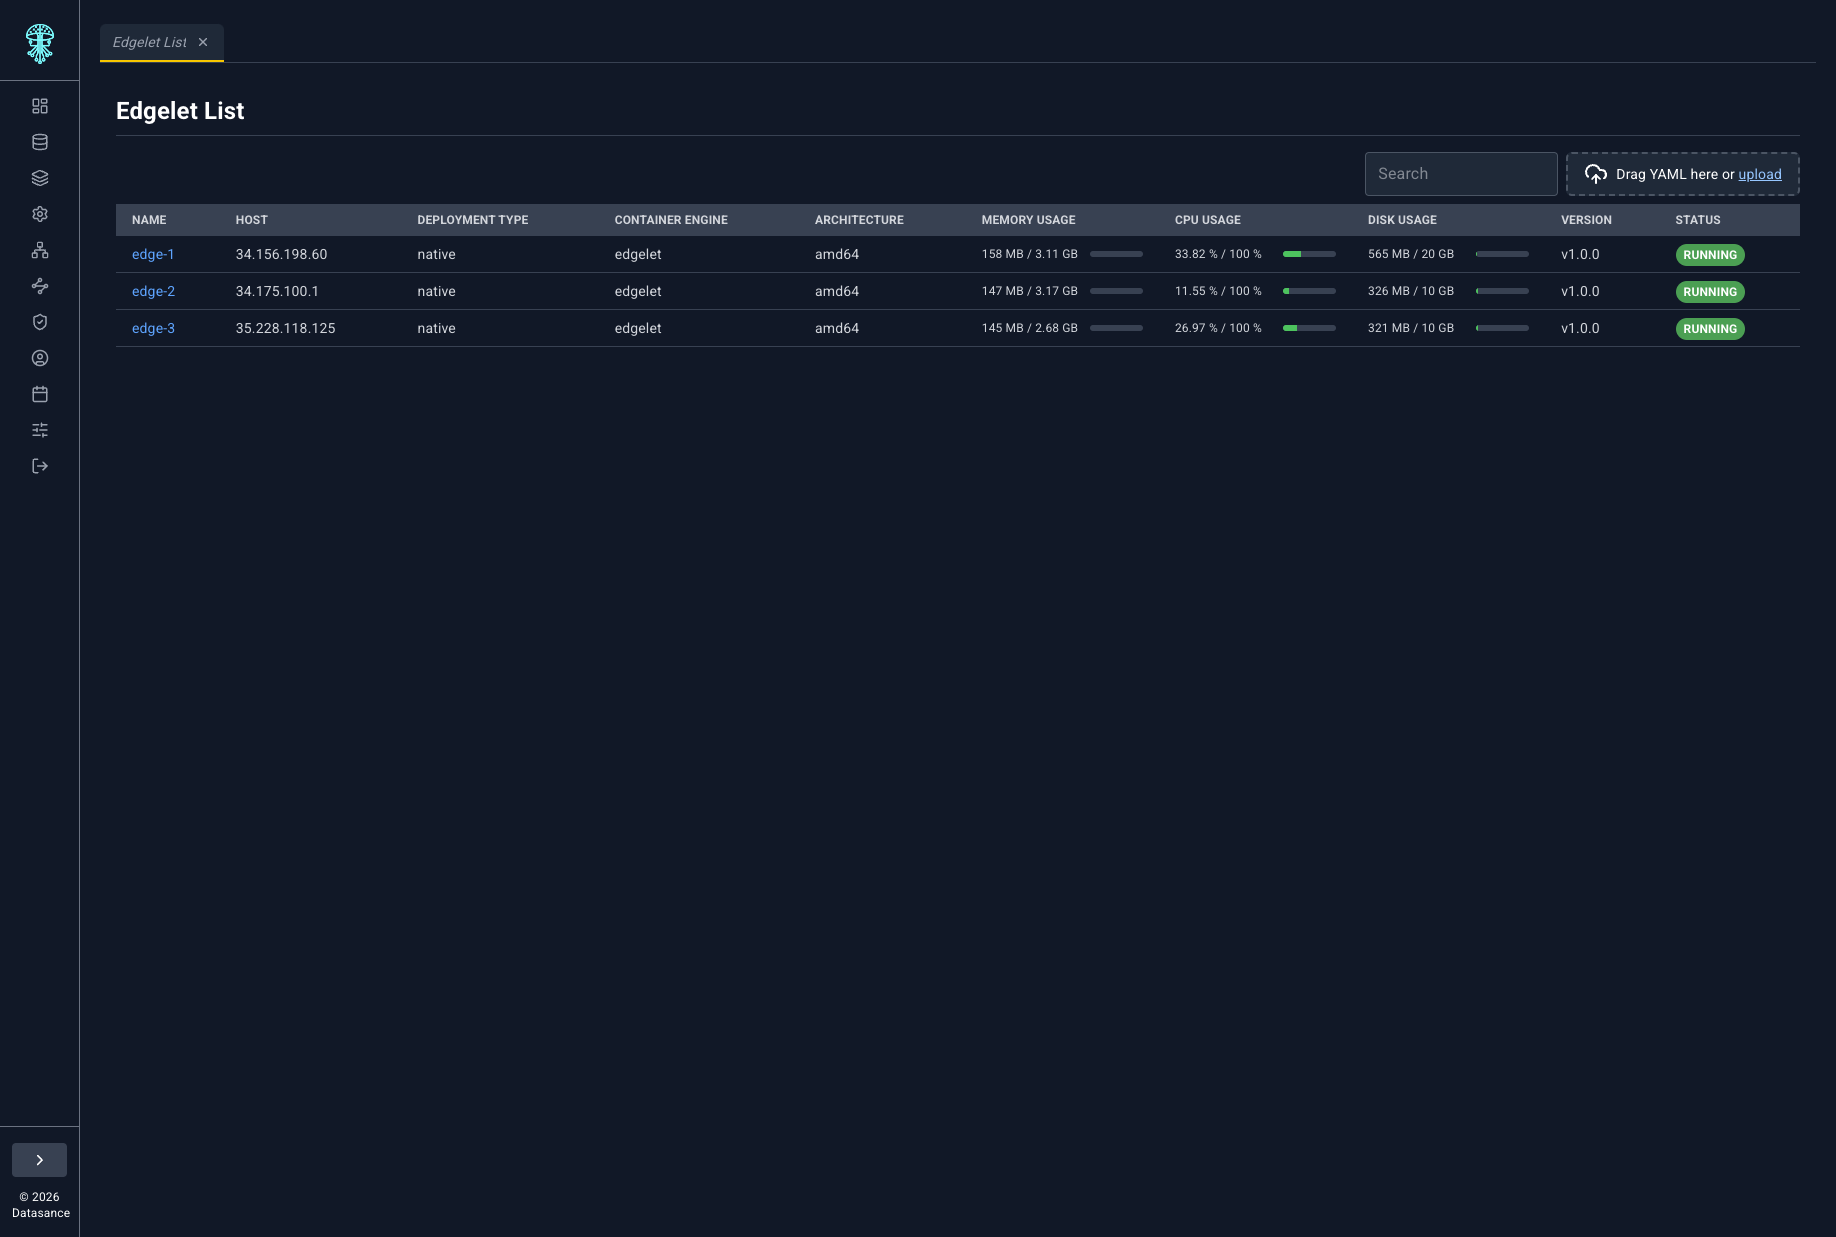
Review every Edgelet node status, resource use, and deployment type from the inventory table.
Memory usage and CPU usage in the table are combined consumption for the Edgelet daemon and embedded containerd. They are not per-microservice totals.
CPU usage is not system-wide. It reflects usage on the CPU core Edgelet runs on, not all cores on the host.
For host-wide capacity, open the node slide-over. Node memoryLimit, cpuLimit, and diskLimit in YAML are monitor-only thresholds. See Edgelet configuration reference.
Geographic map
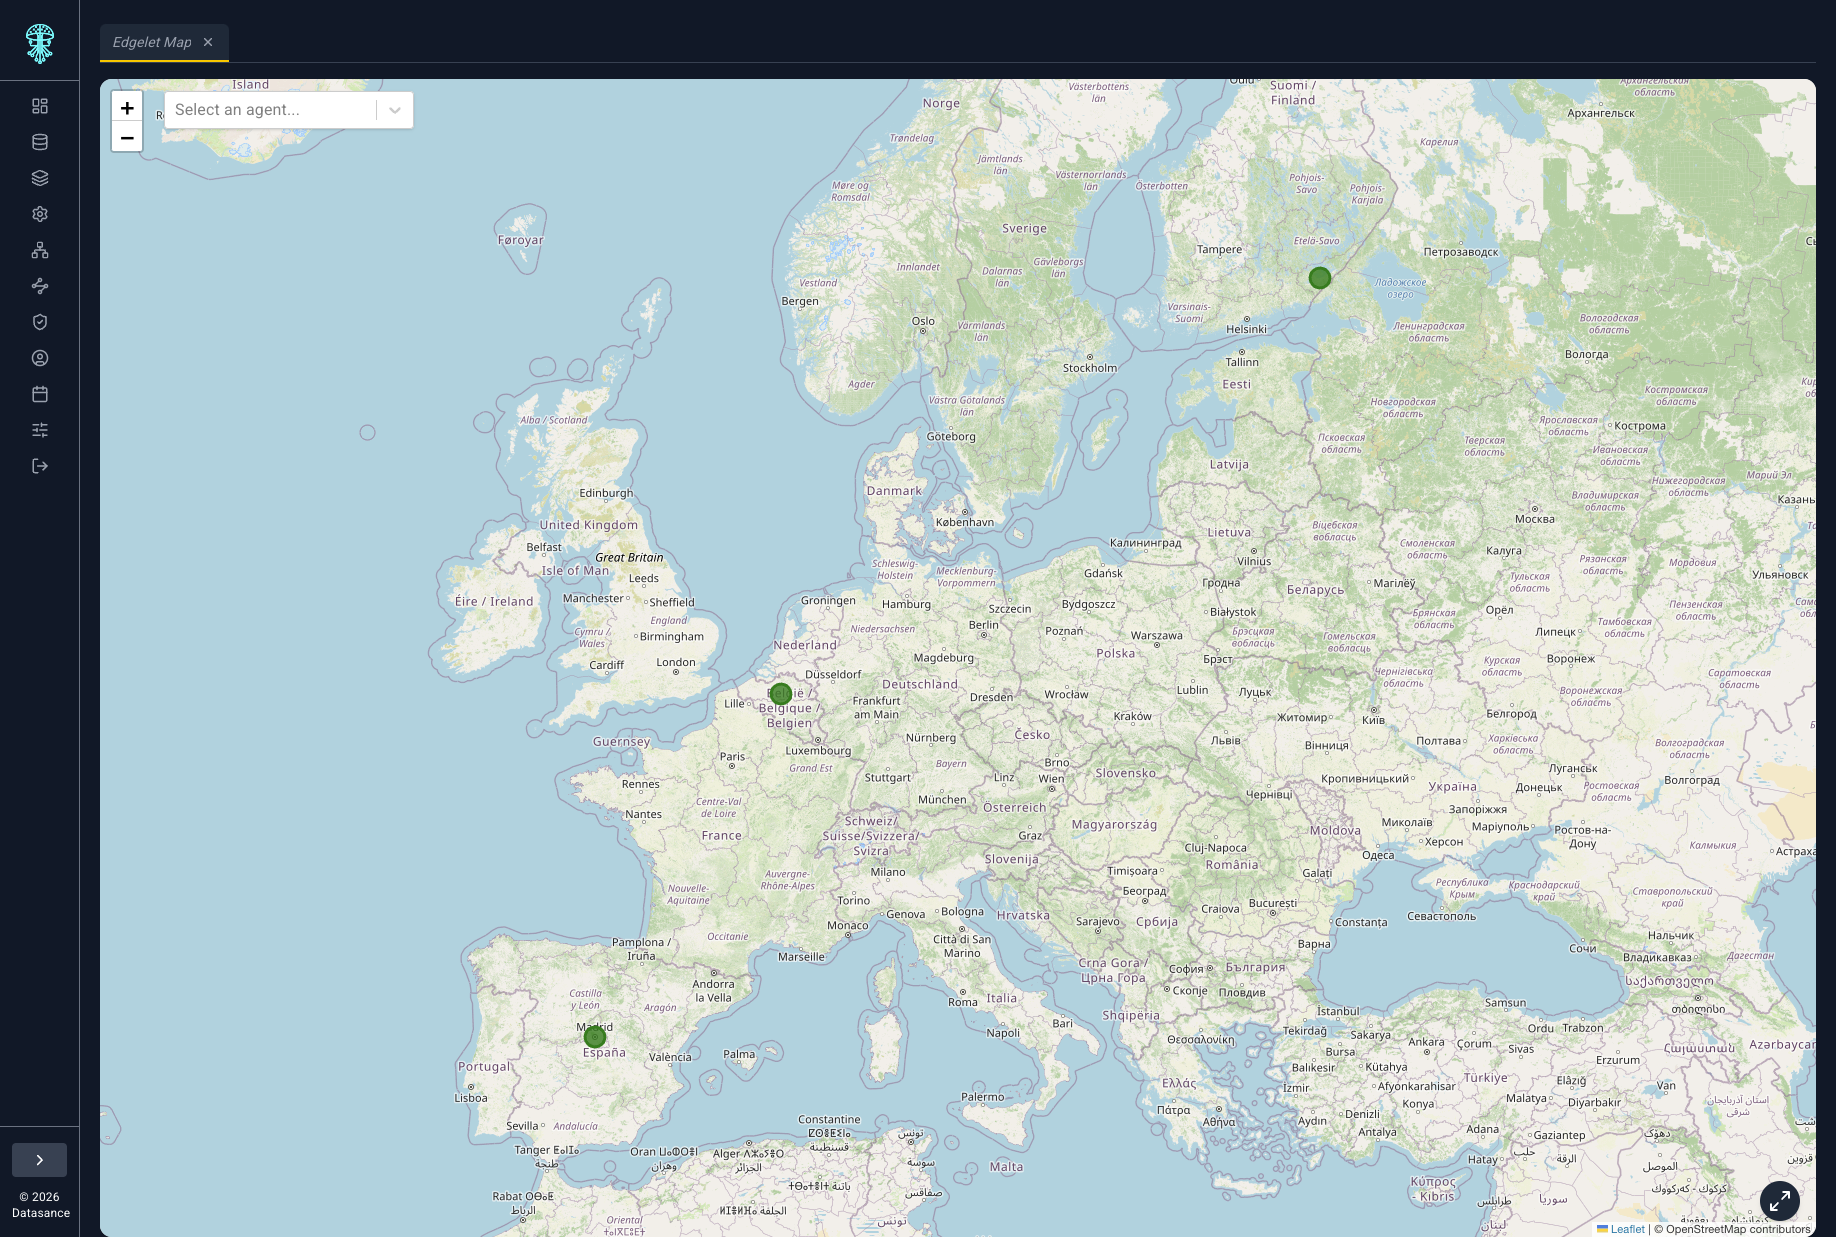
Visualize Edgelet nodes on a map when latitude and longitude are set in the node spec.
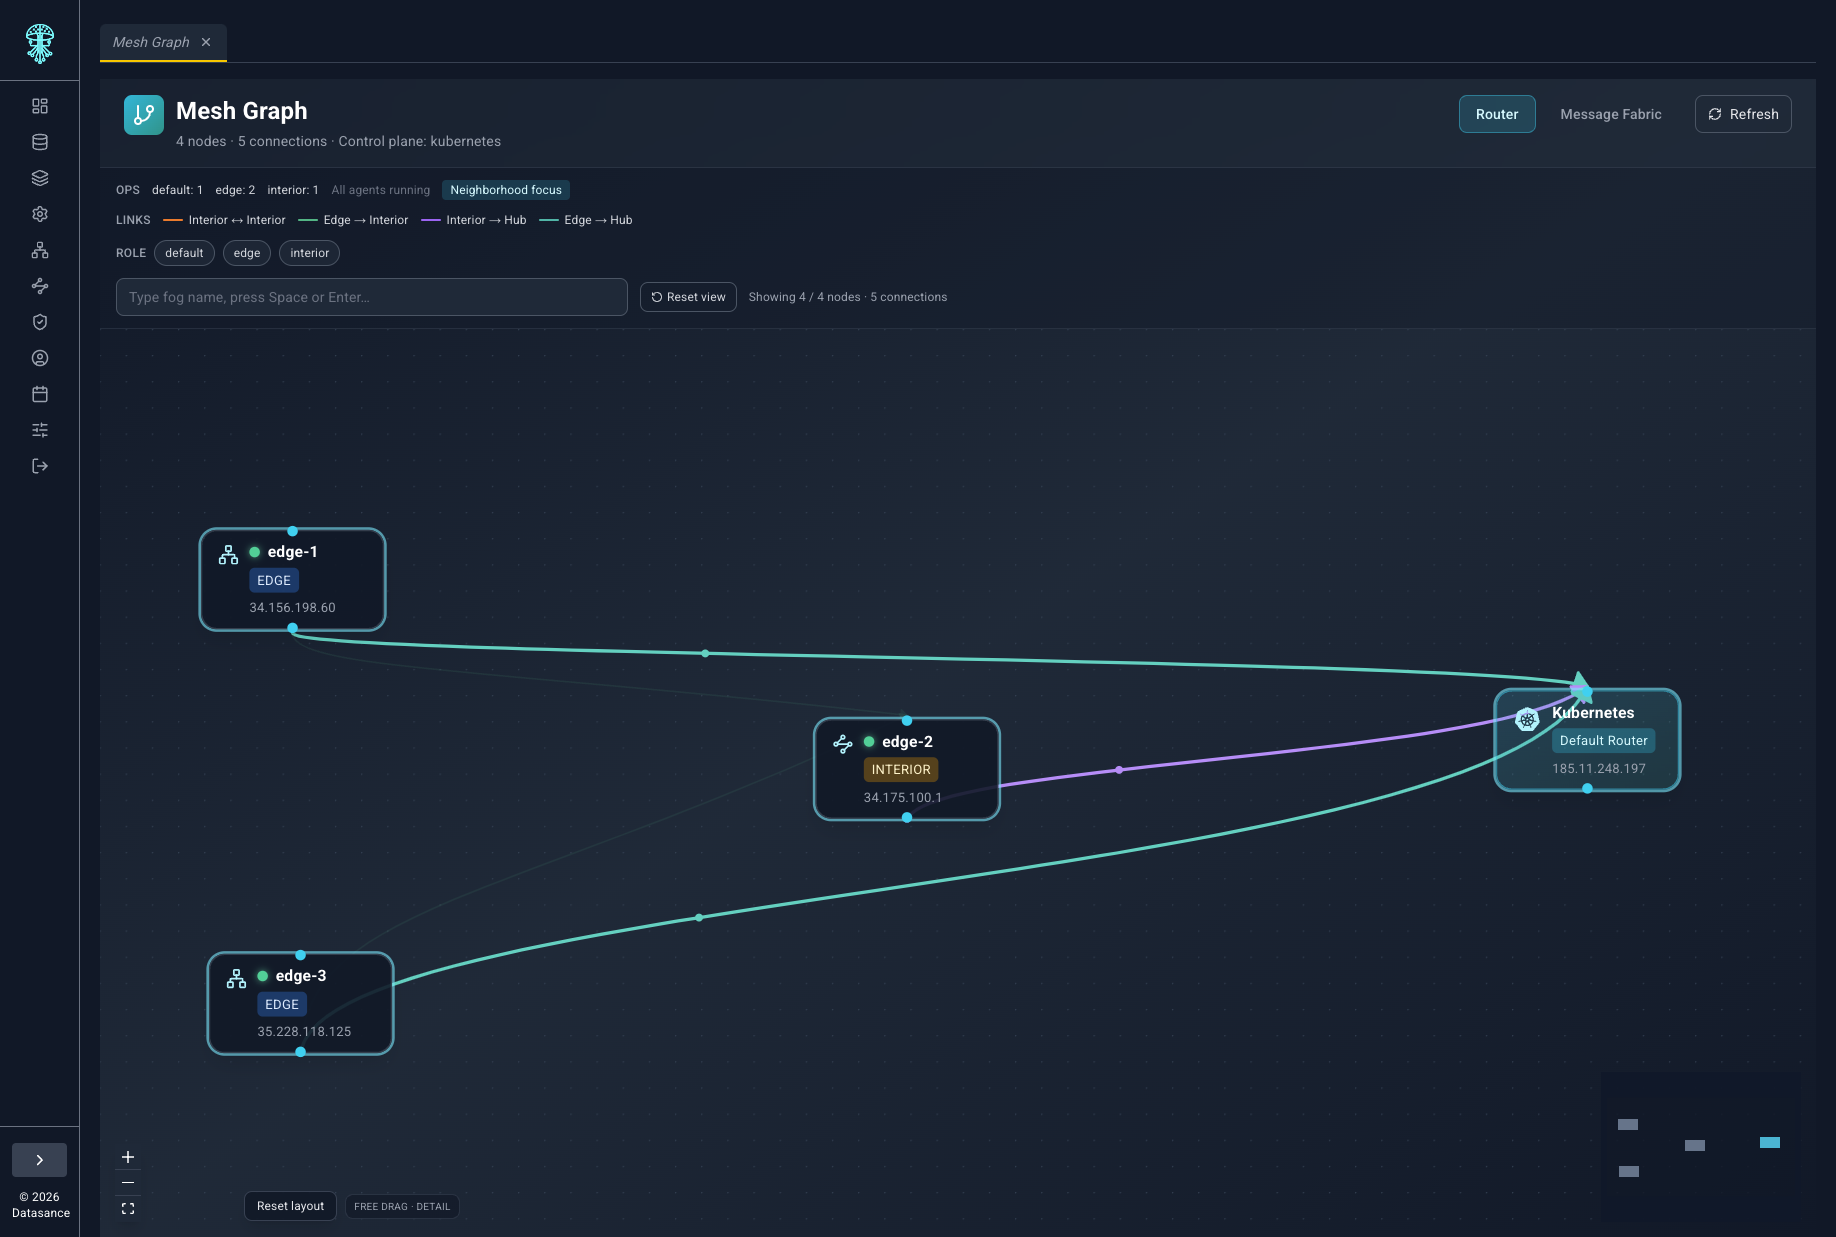
Mesh graph
Inspect router topology and Message Fabric links between Edgelet nodes and the control plane hub.
Detailed insights
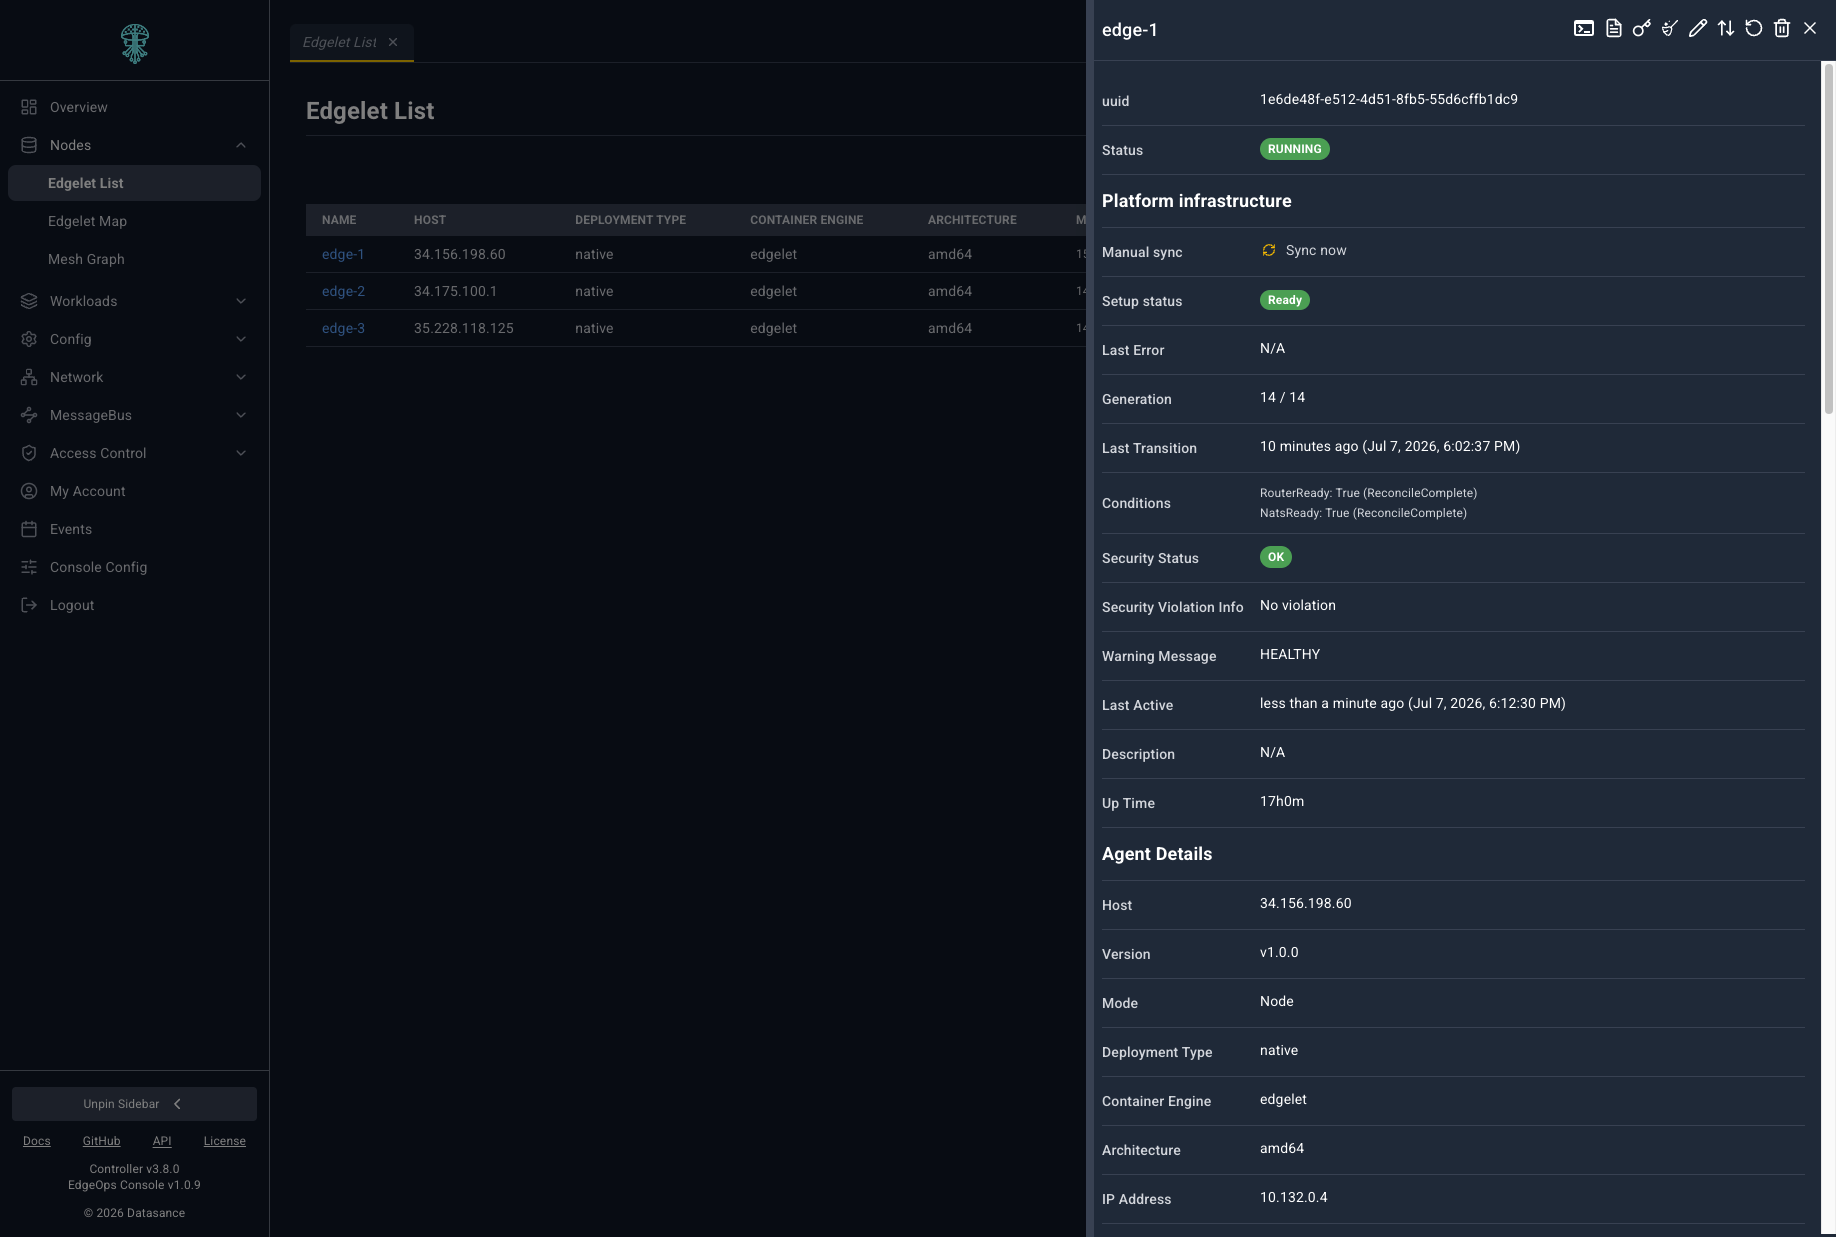
Each node slide-over exposes platform setup, security status, agent details, and connected resources.
The slide-over also shows host-wide totals: total CPU usage across the node, available memory, and disk usage. Use these fields when you need full-machine capacity, not the combined Edgelet stack figures in the list table.
Declarative editing
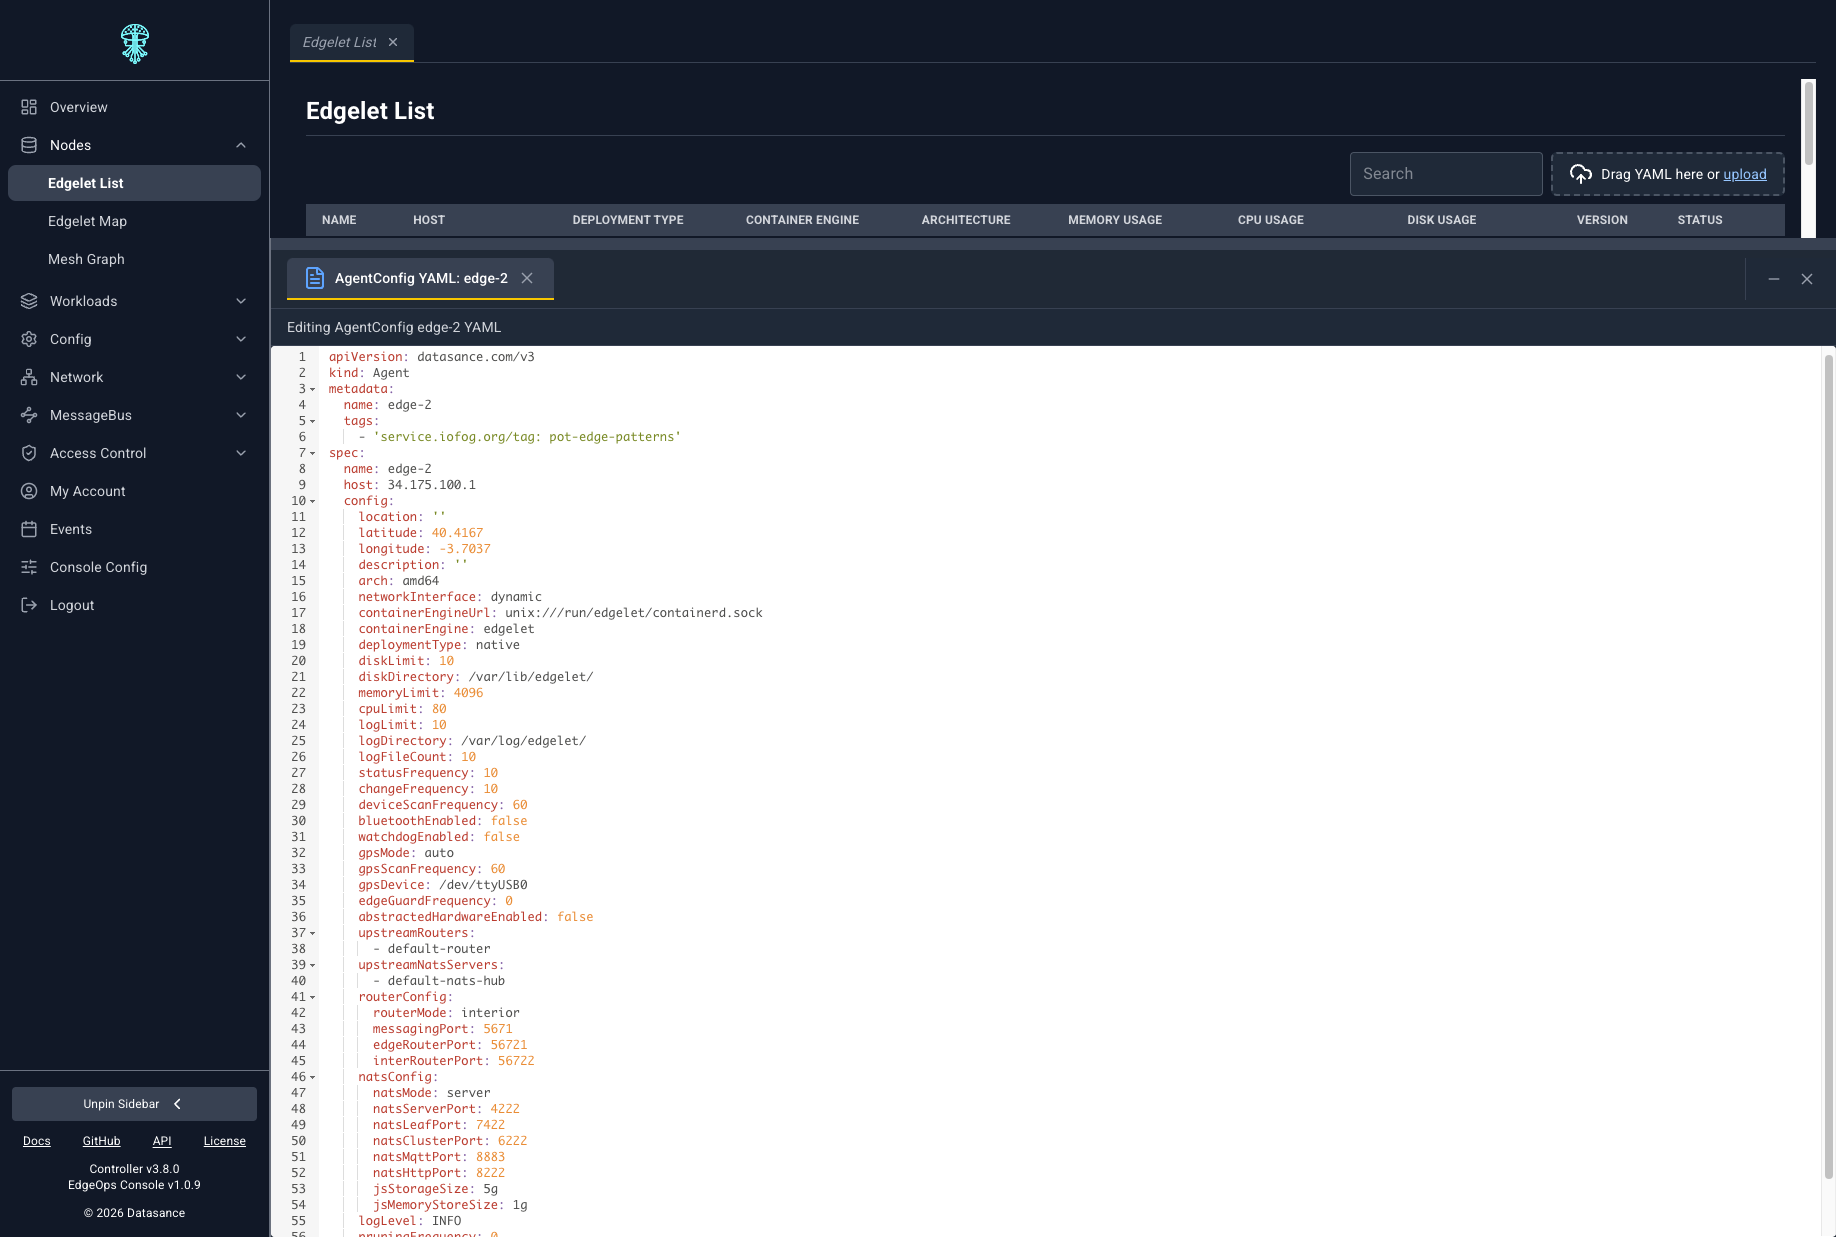
Edit the full node spec in YAML. Changes are validated and sent to the Controller the same way potctl applies them.
Remote shell, exec and log sessions
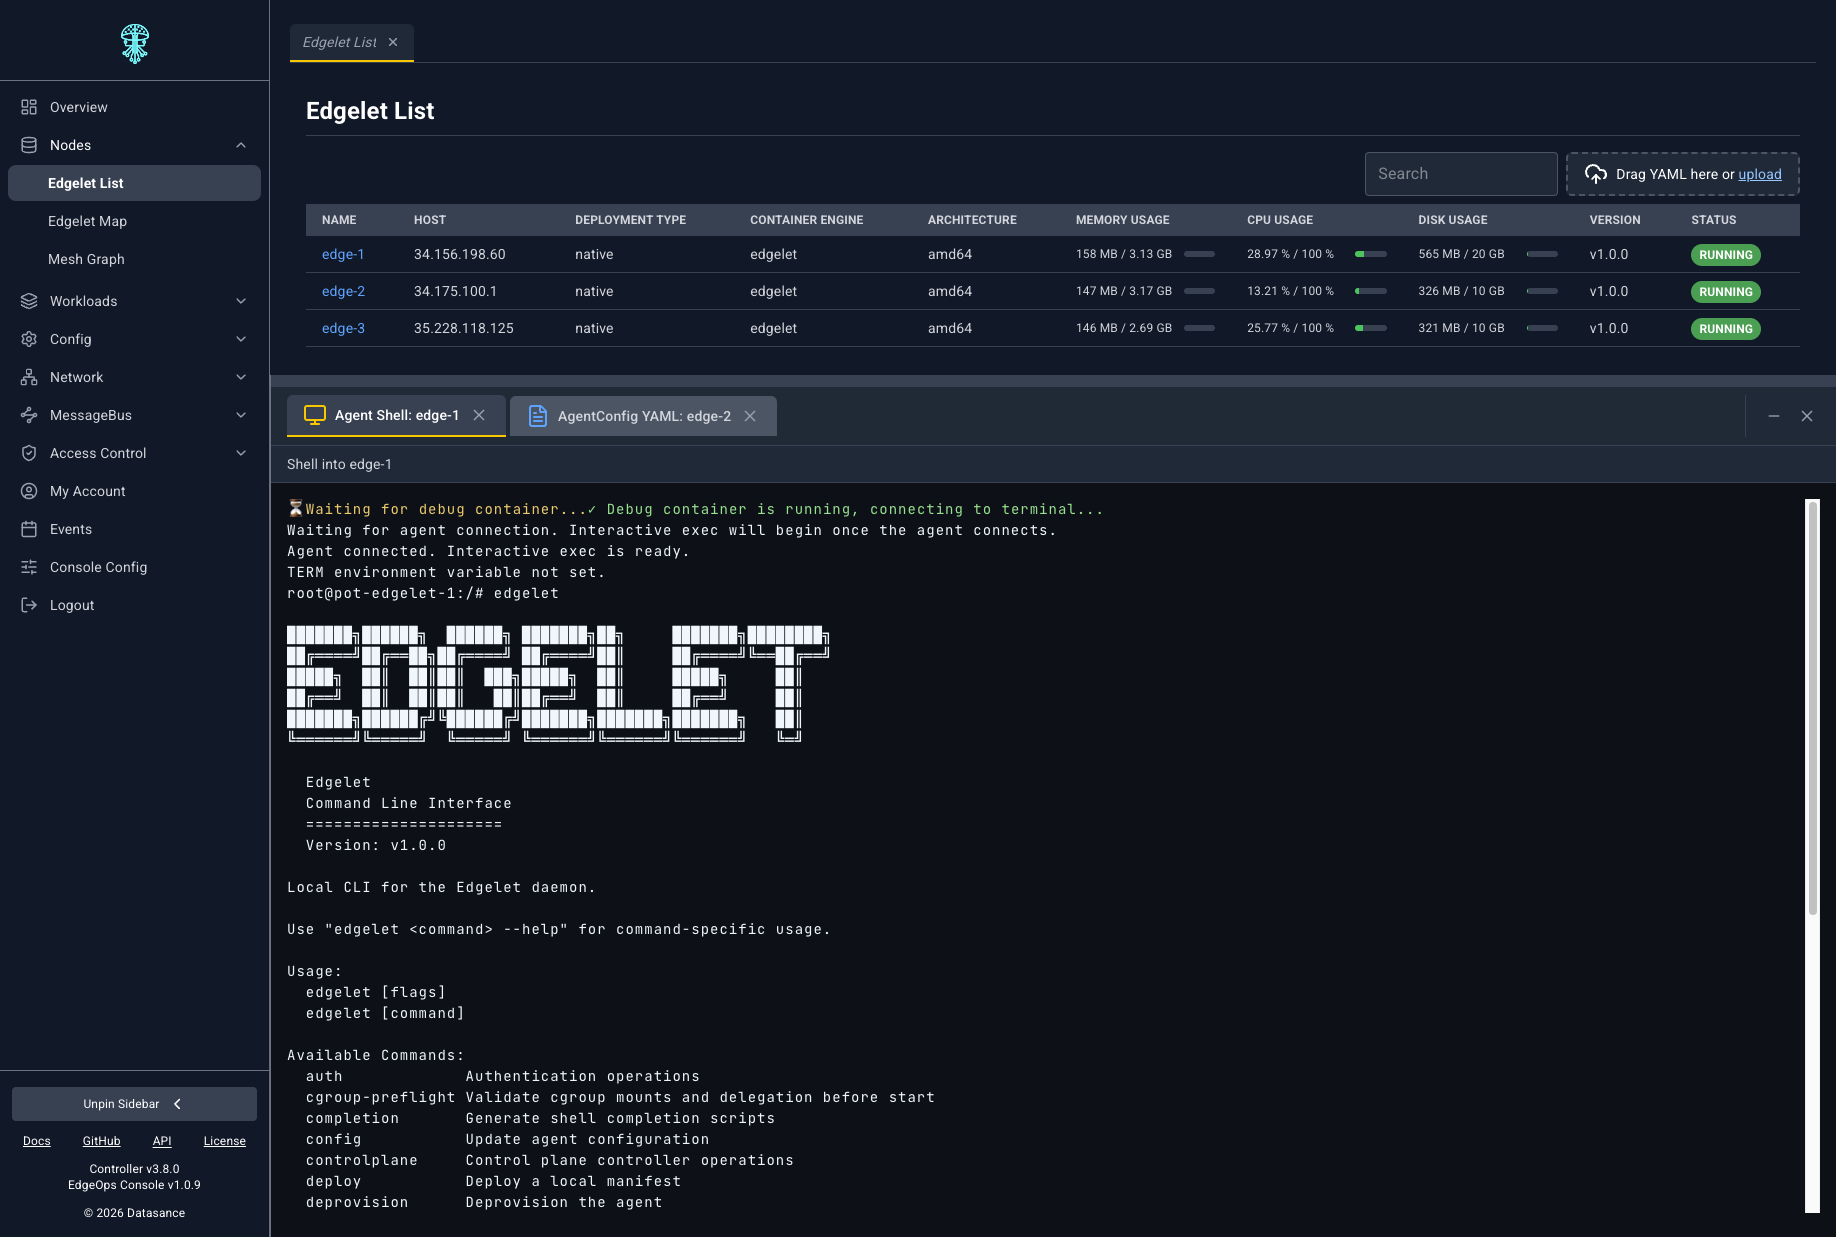
Open an interactive terminal or tail log session on an Edgelet node and microservices for diagnostics without SSH to the device.
Applications and microservices
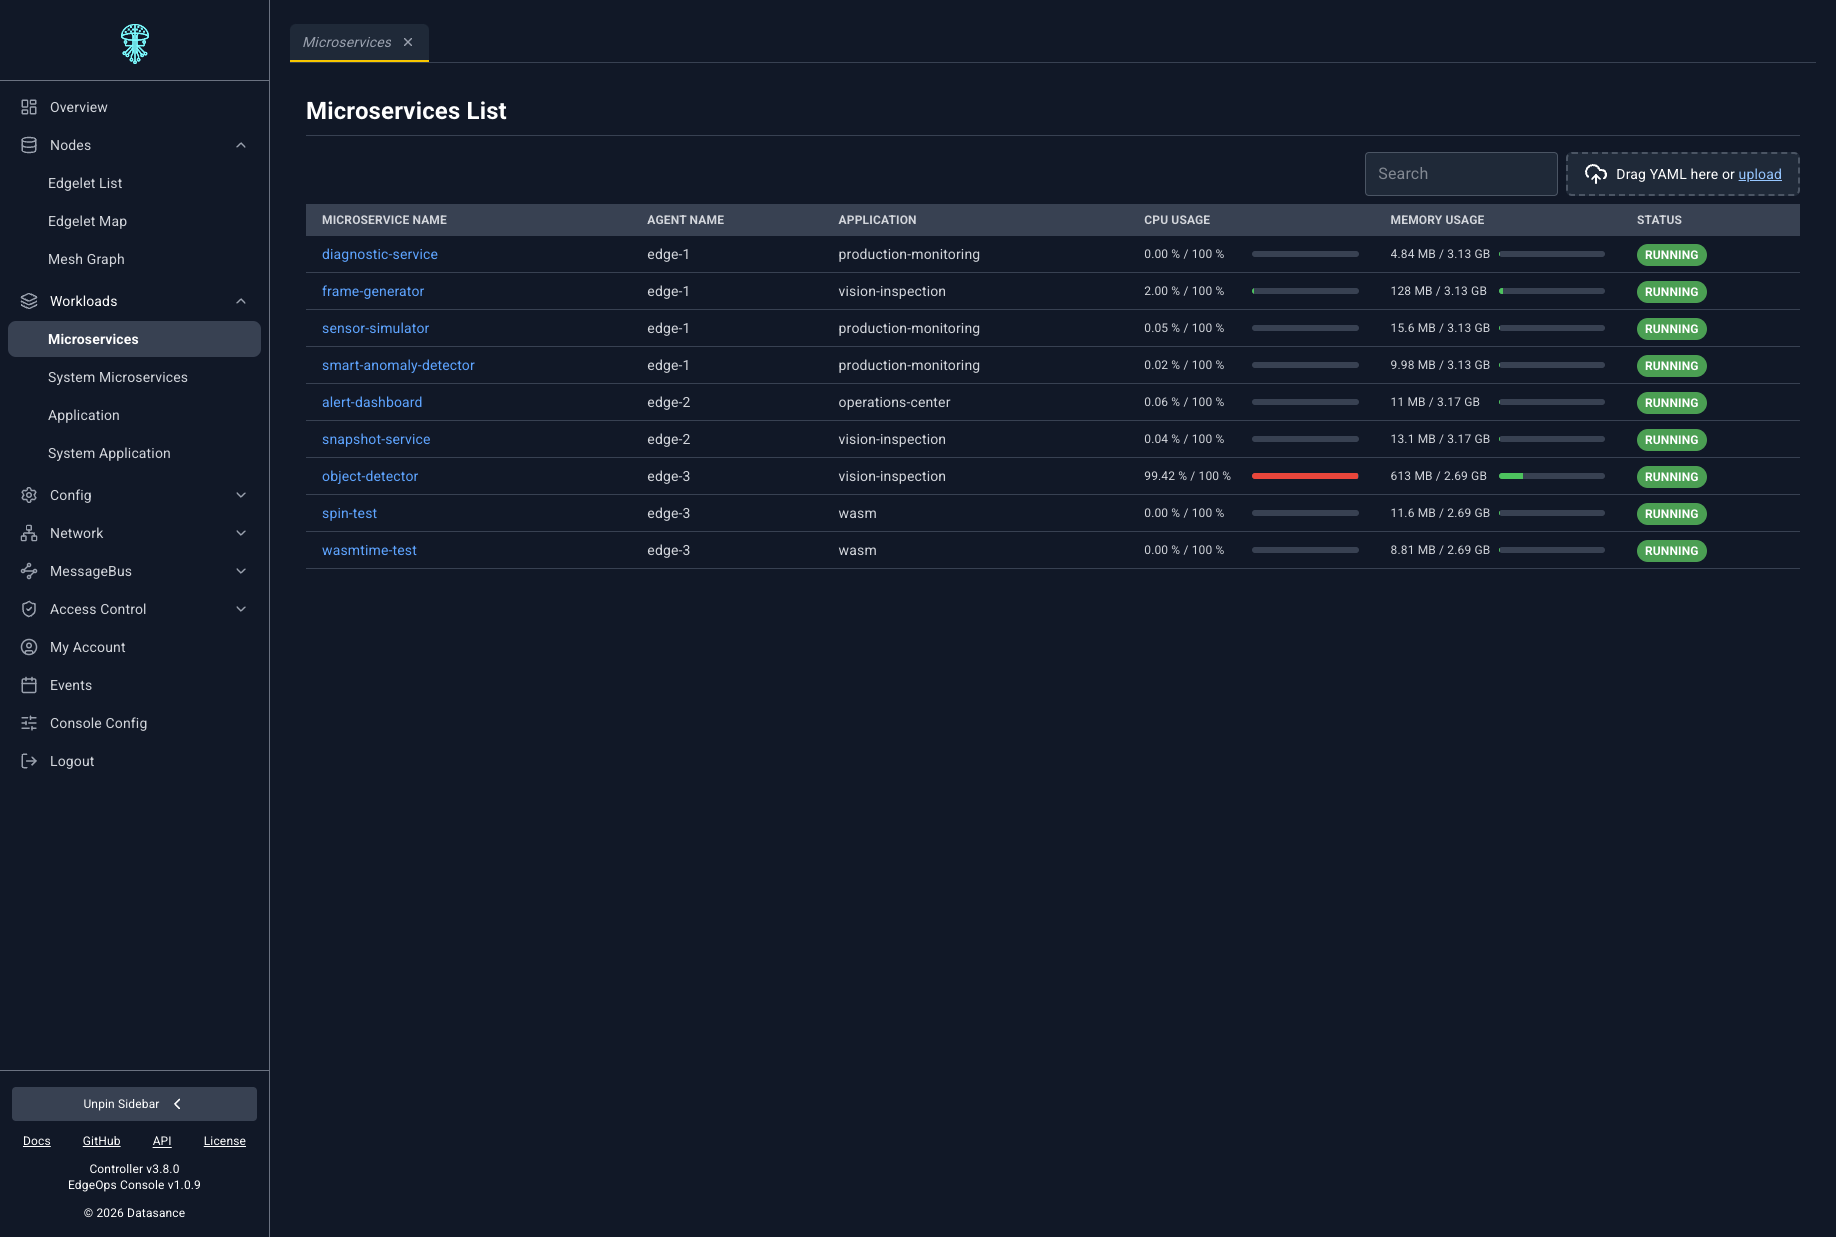
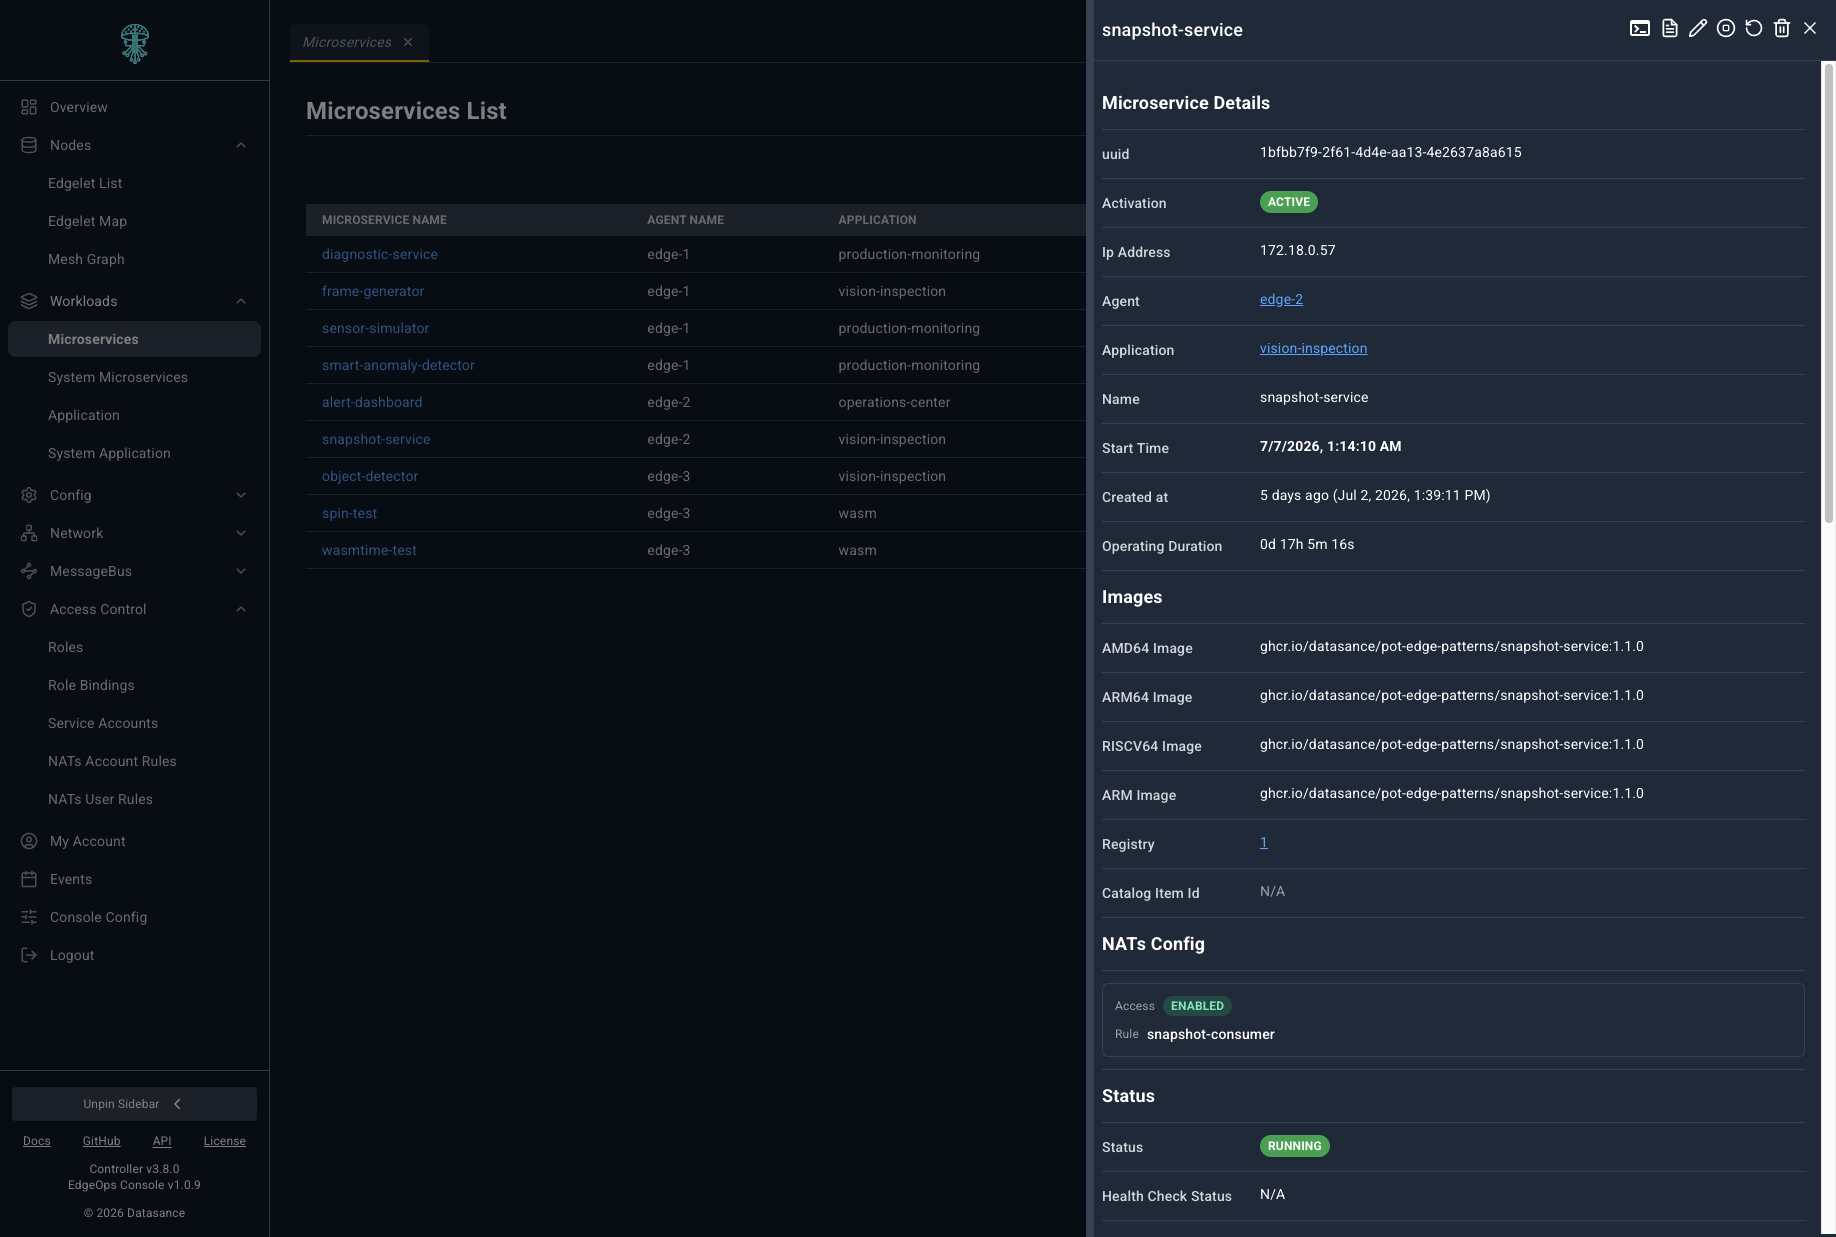
Workloads covers user applications and microservices. List, filter, start, stop, scale, and inspect routes from the same views potctl uses.
Microservice inventory
List and filter every microservice deployed across the ECN.
Services and routing
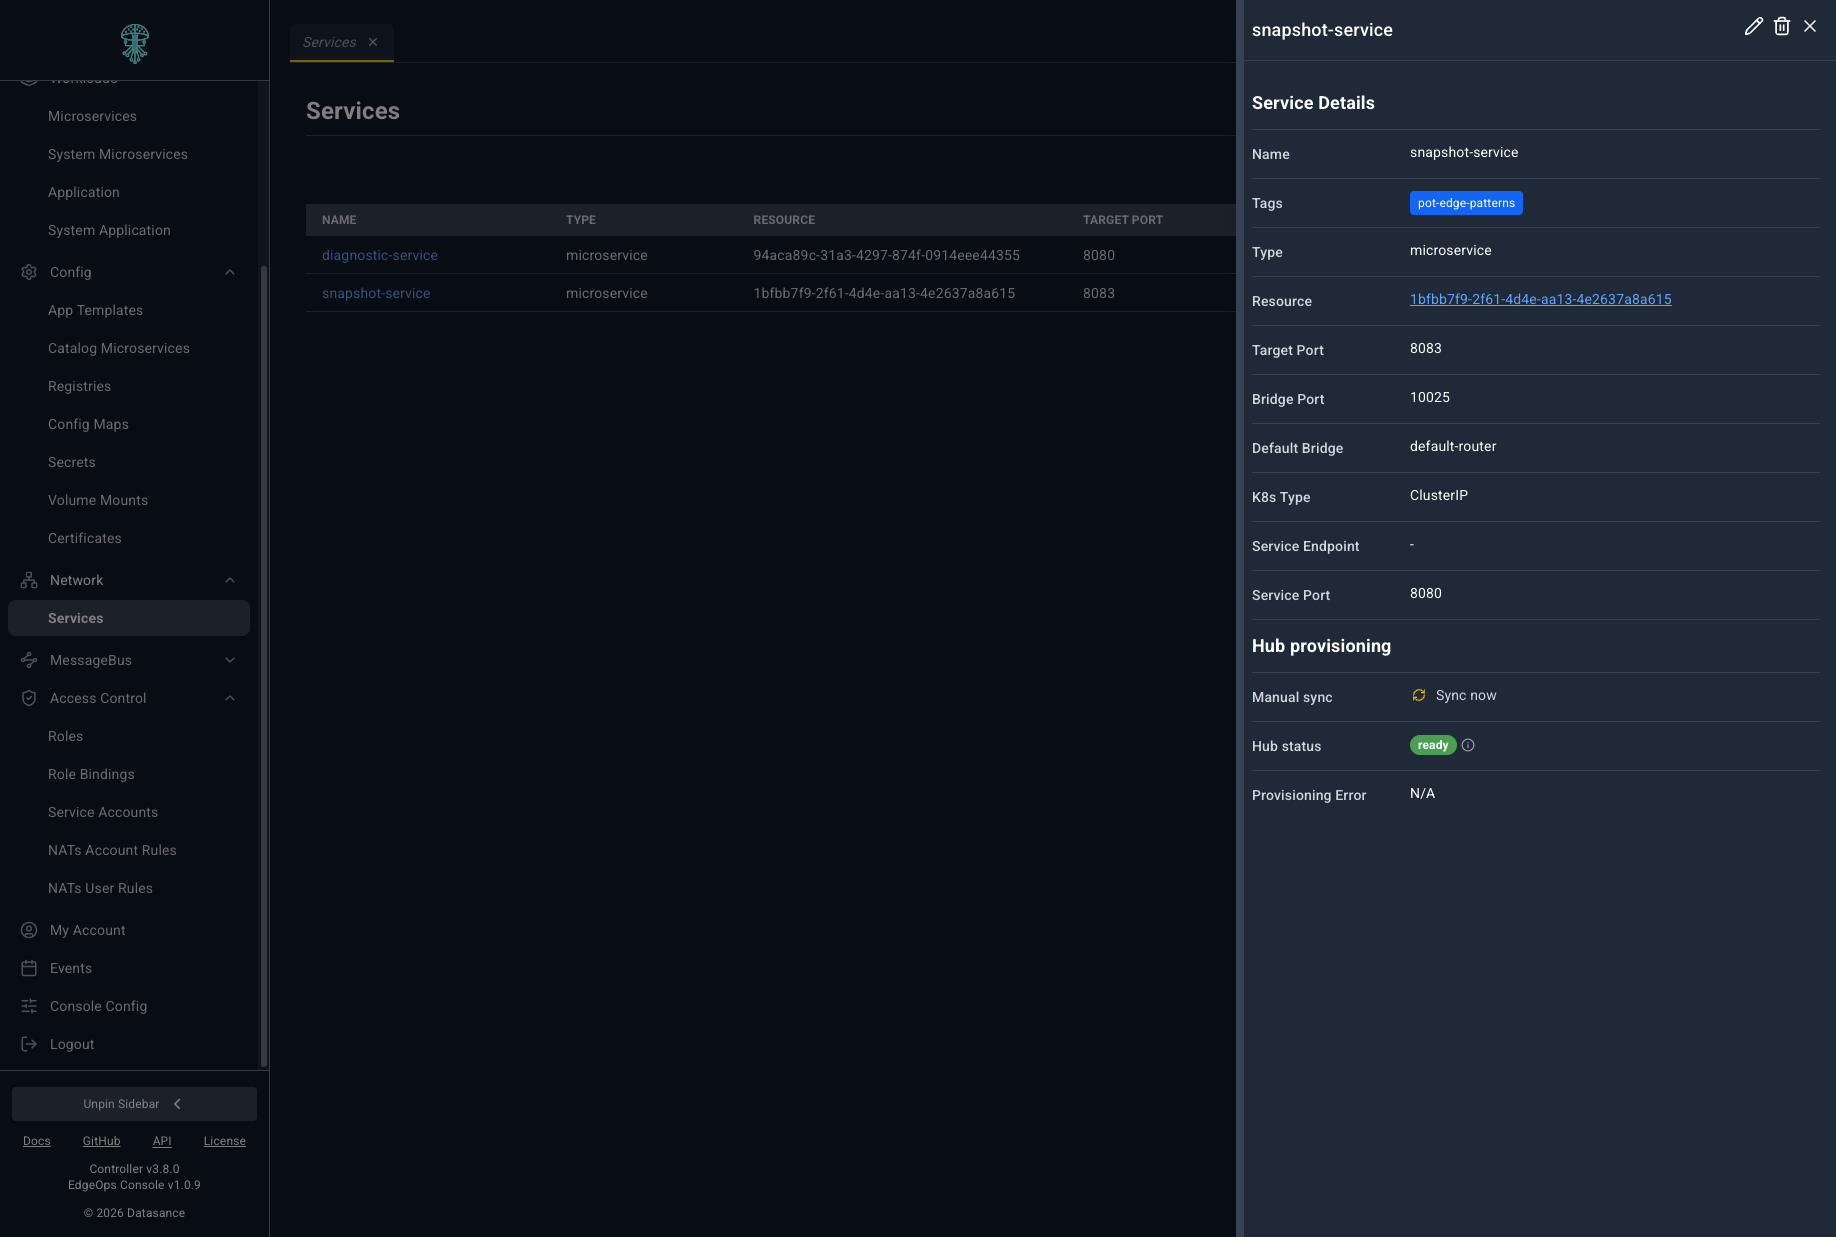
Manage TCP bridge services, target ports, and hub provisioning from the Network section.
Registries
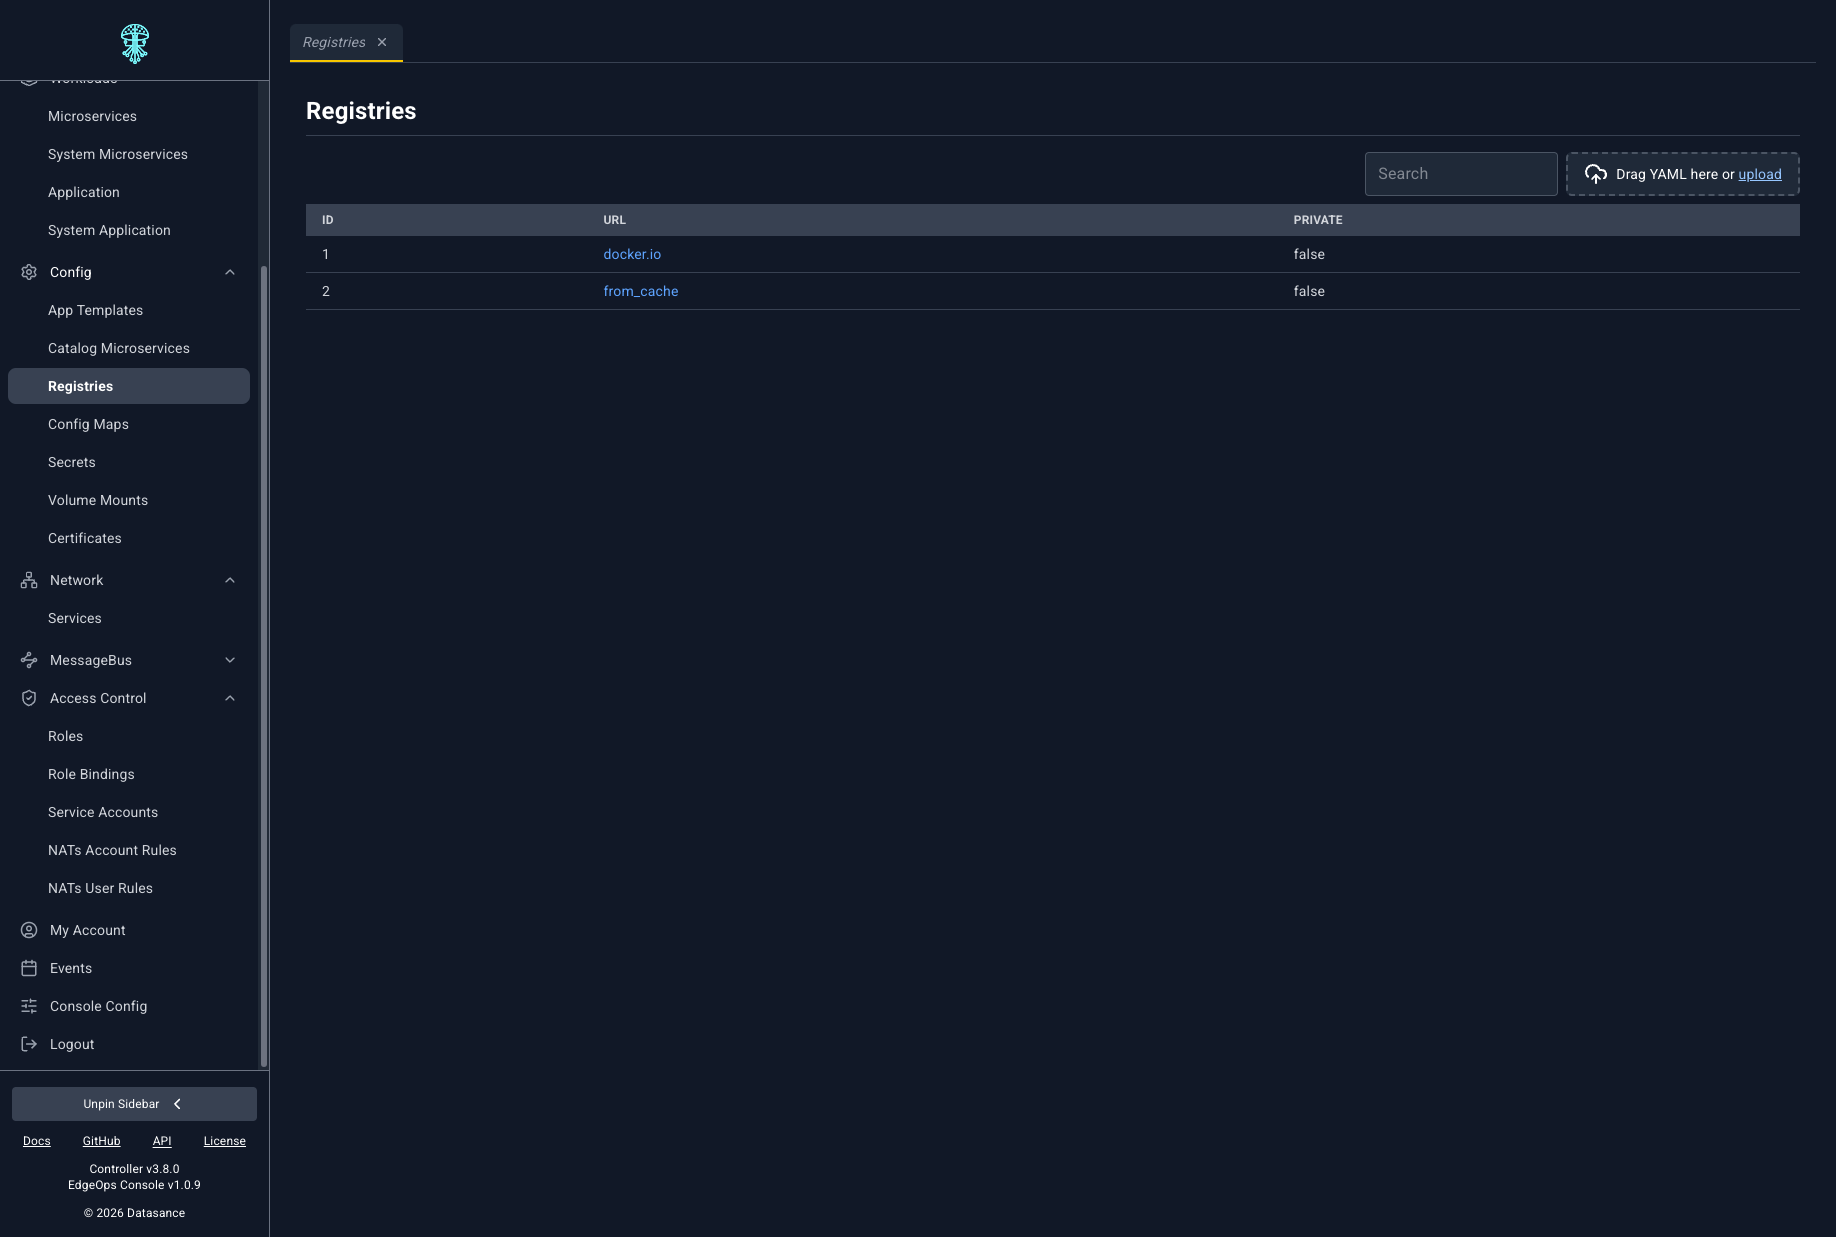
Browse and manage container registries used by microservice images.
Cluster config editors
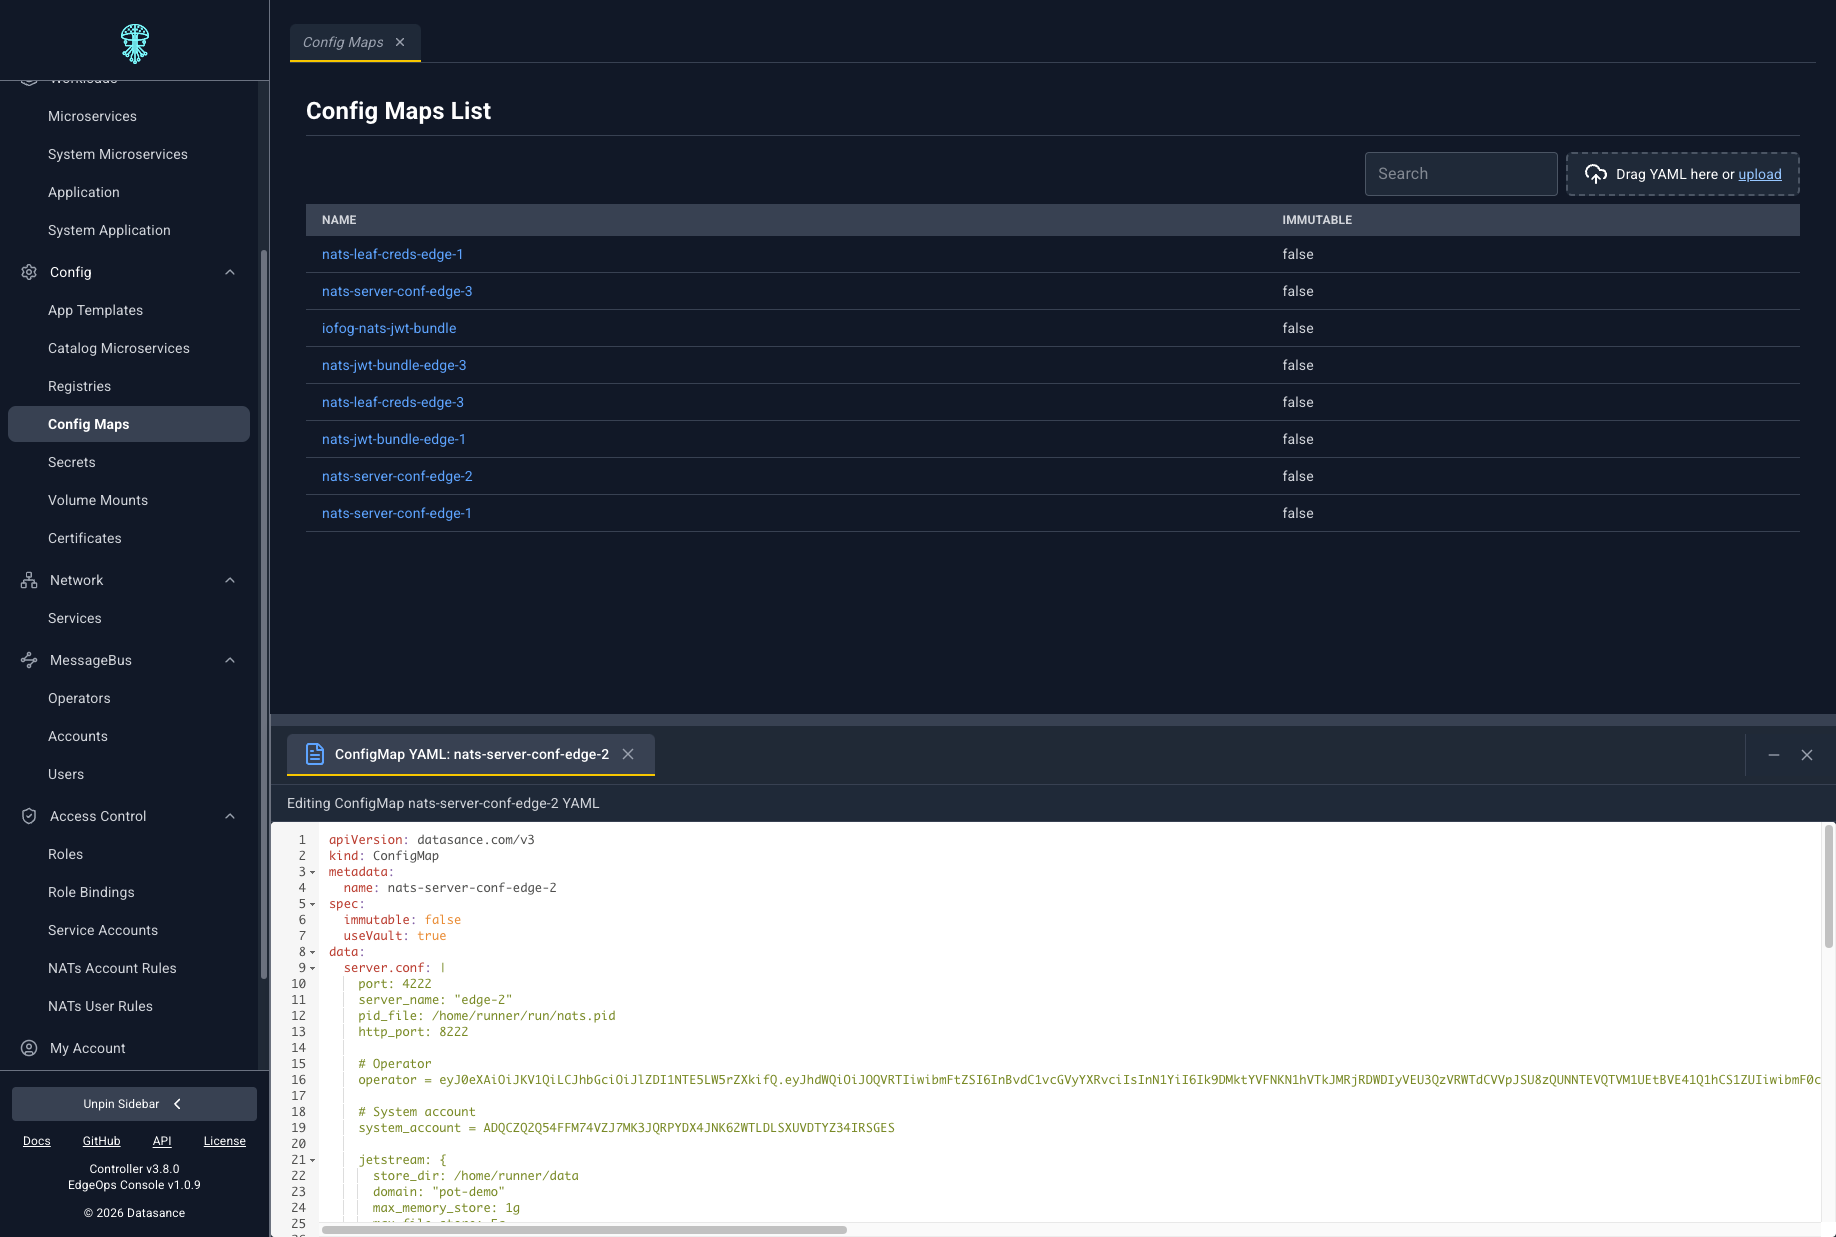
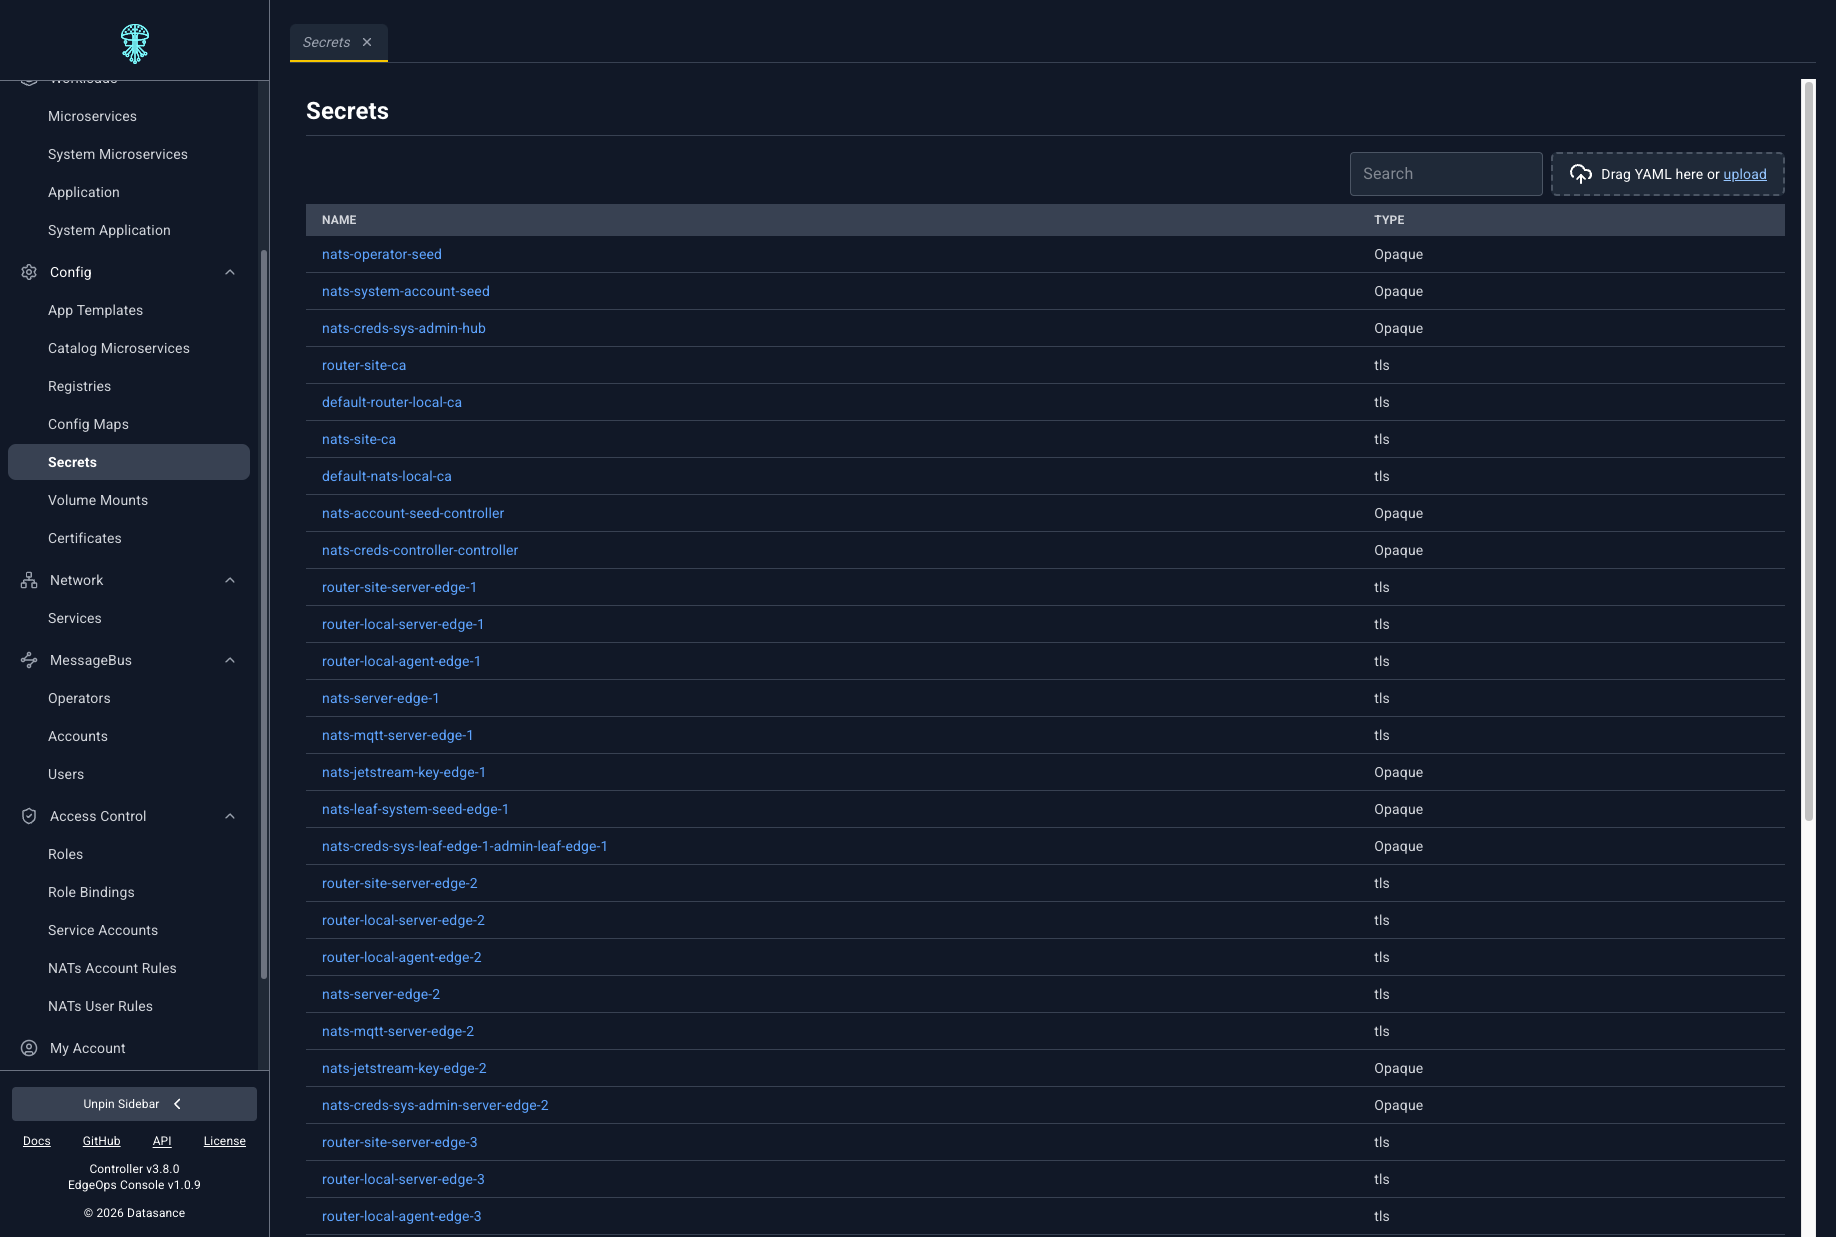
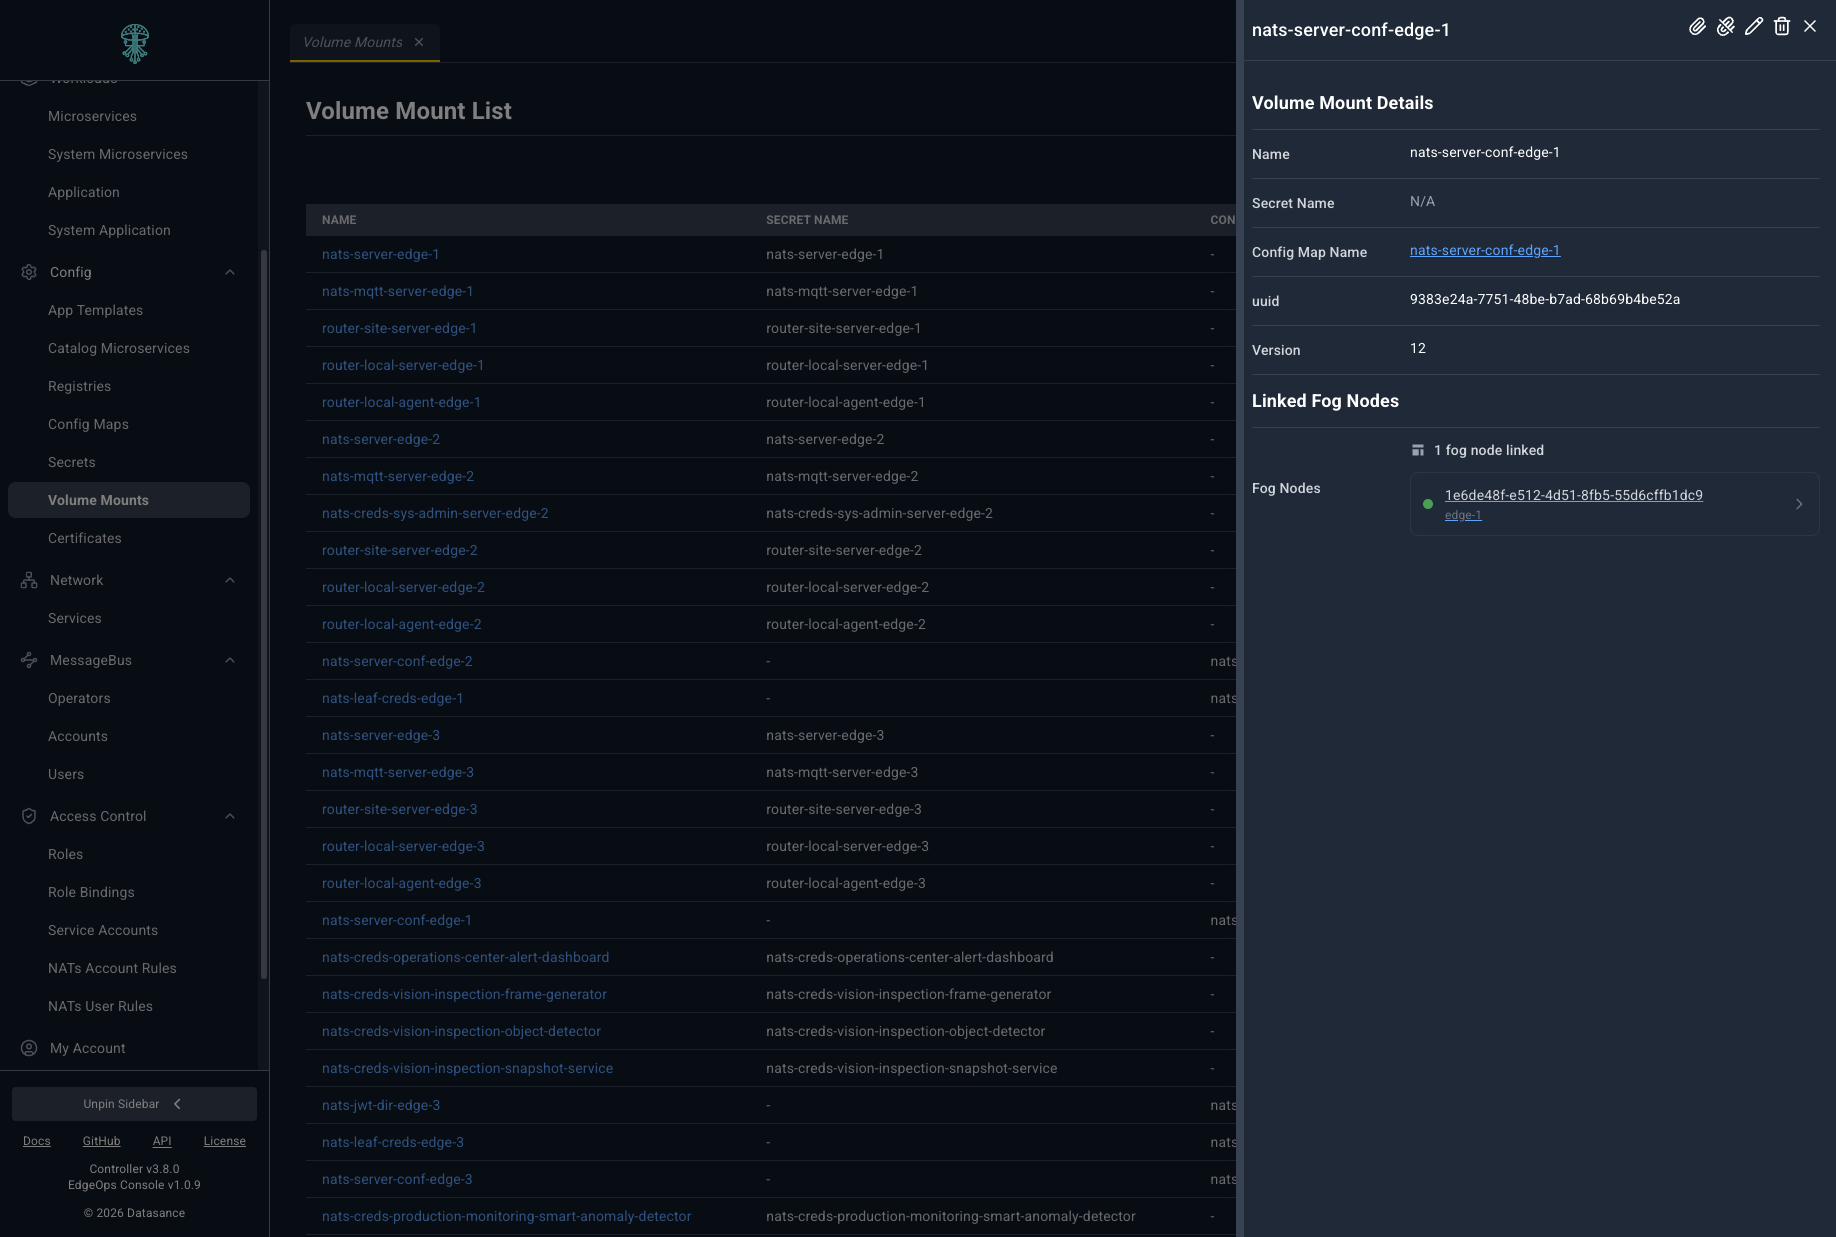
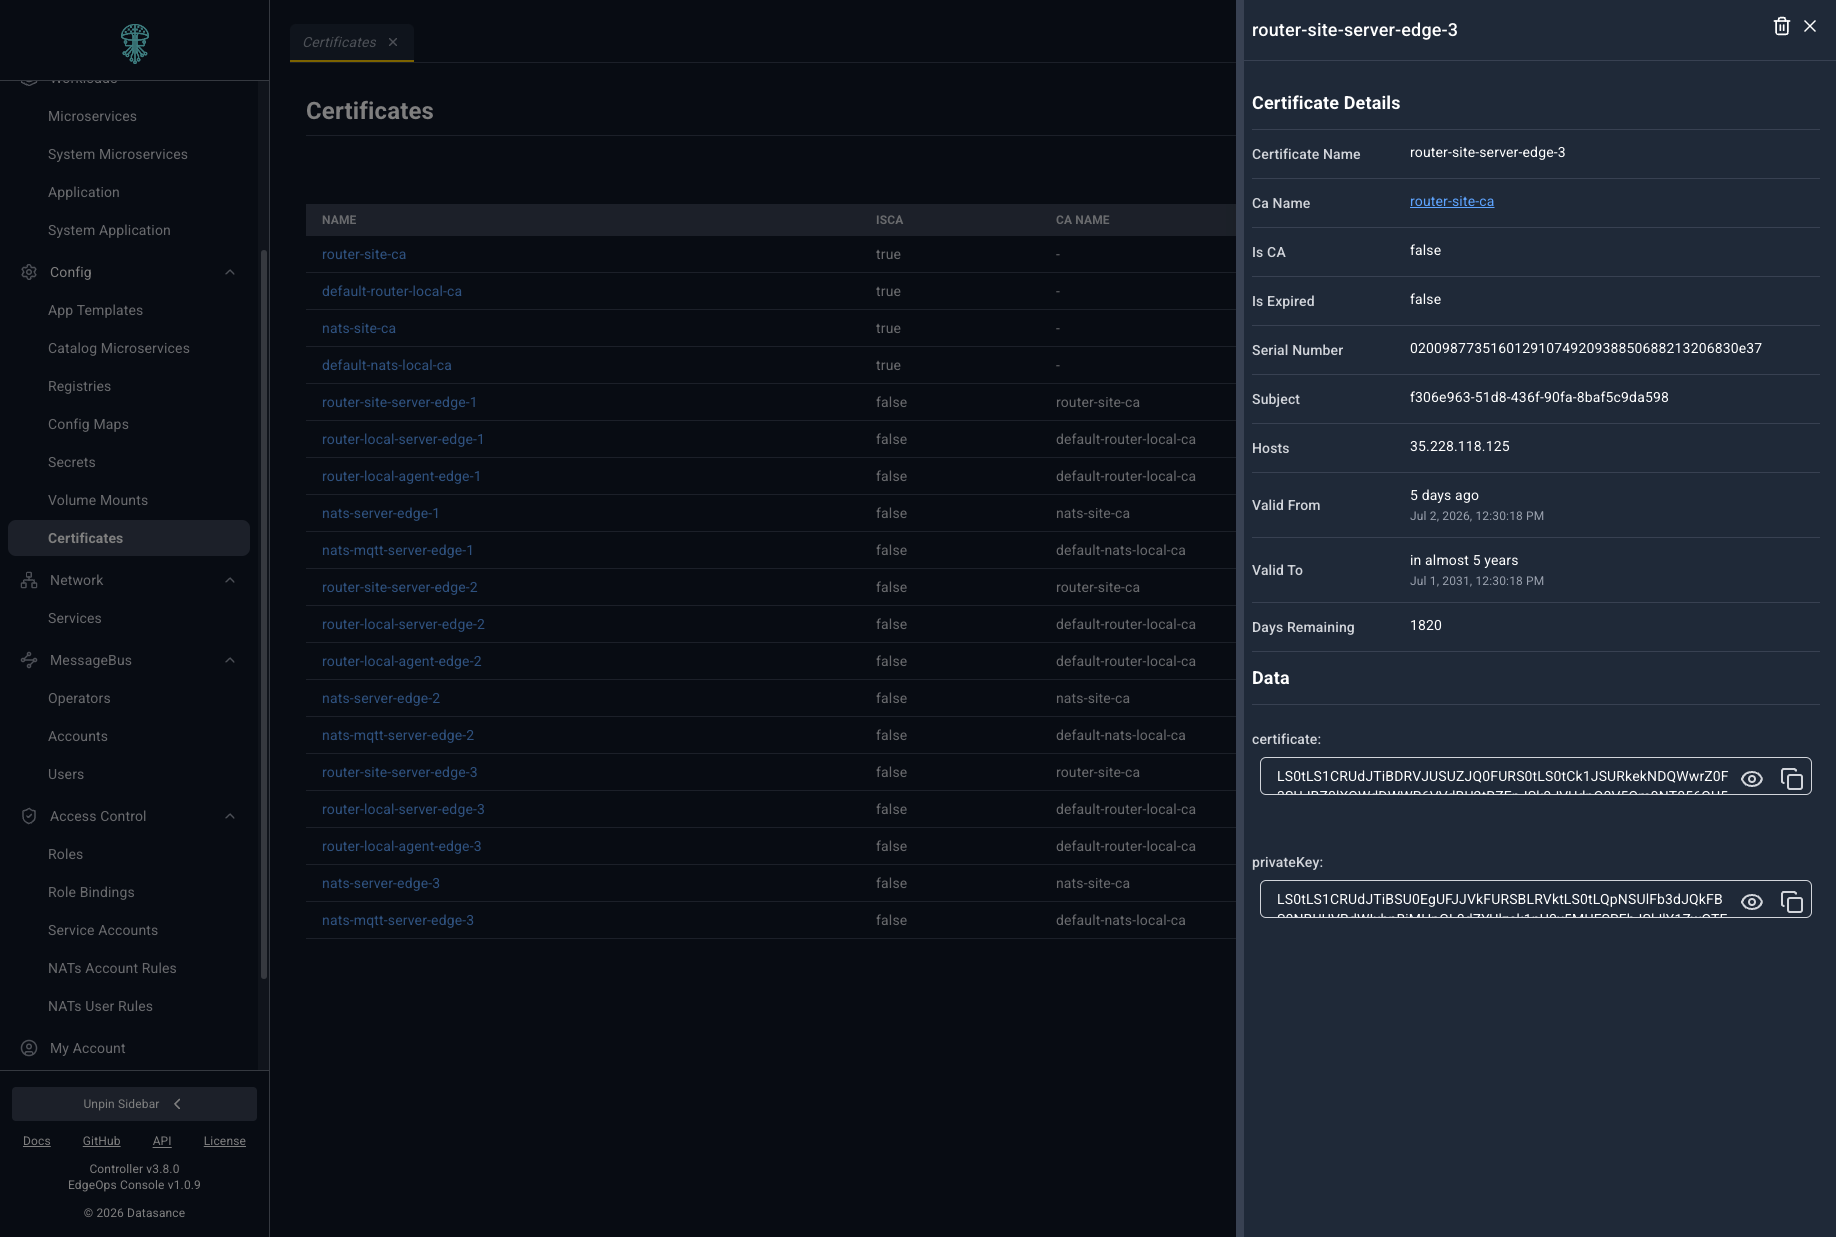
Dedicated editors cover ConfigMaps, Secrets, volume mounts, and certificates. Each resource supports list views, detail panels, and YAML editing.
Exec and log sessions
Open an interactive terminal on an Edgelet node or inside a microservice container from the Console UI. Stream microservice logs in real time over the same WebSocket transport.
Controller v3.8.0 uses a multi-session exec model:
- REST
POST/DELETE .../execon microservices is removed - Each exec opens its own WebSocket session with a unique session id
- Default limit: 5 concurrent exec sessions per microservice (Controller quota)
The Console and potctl use the same session flow as the REST API. For protocol details, limits, and local edgelet ms exec, see Exec sessions.
Log streaming uses the same WebSocket channel family. See Microservice logs.
Identity, access control, and messaging
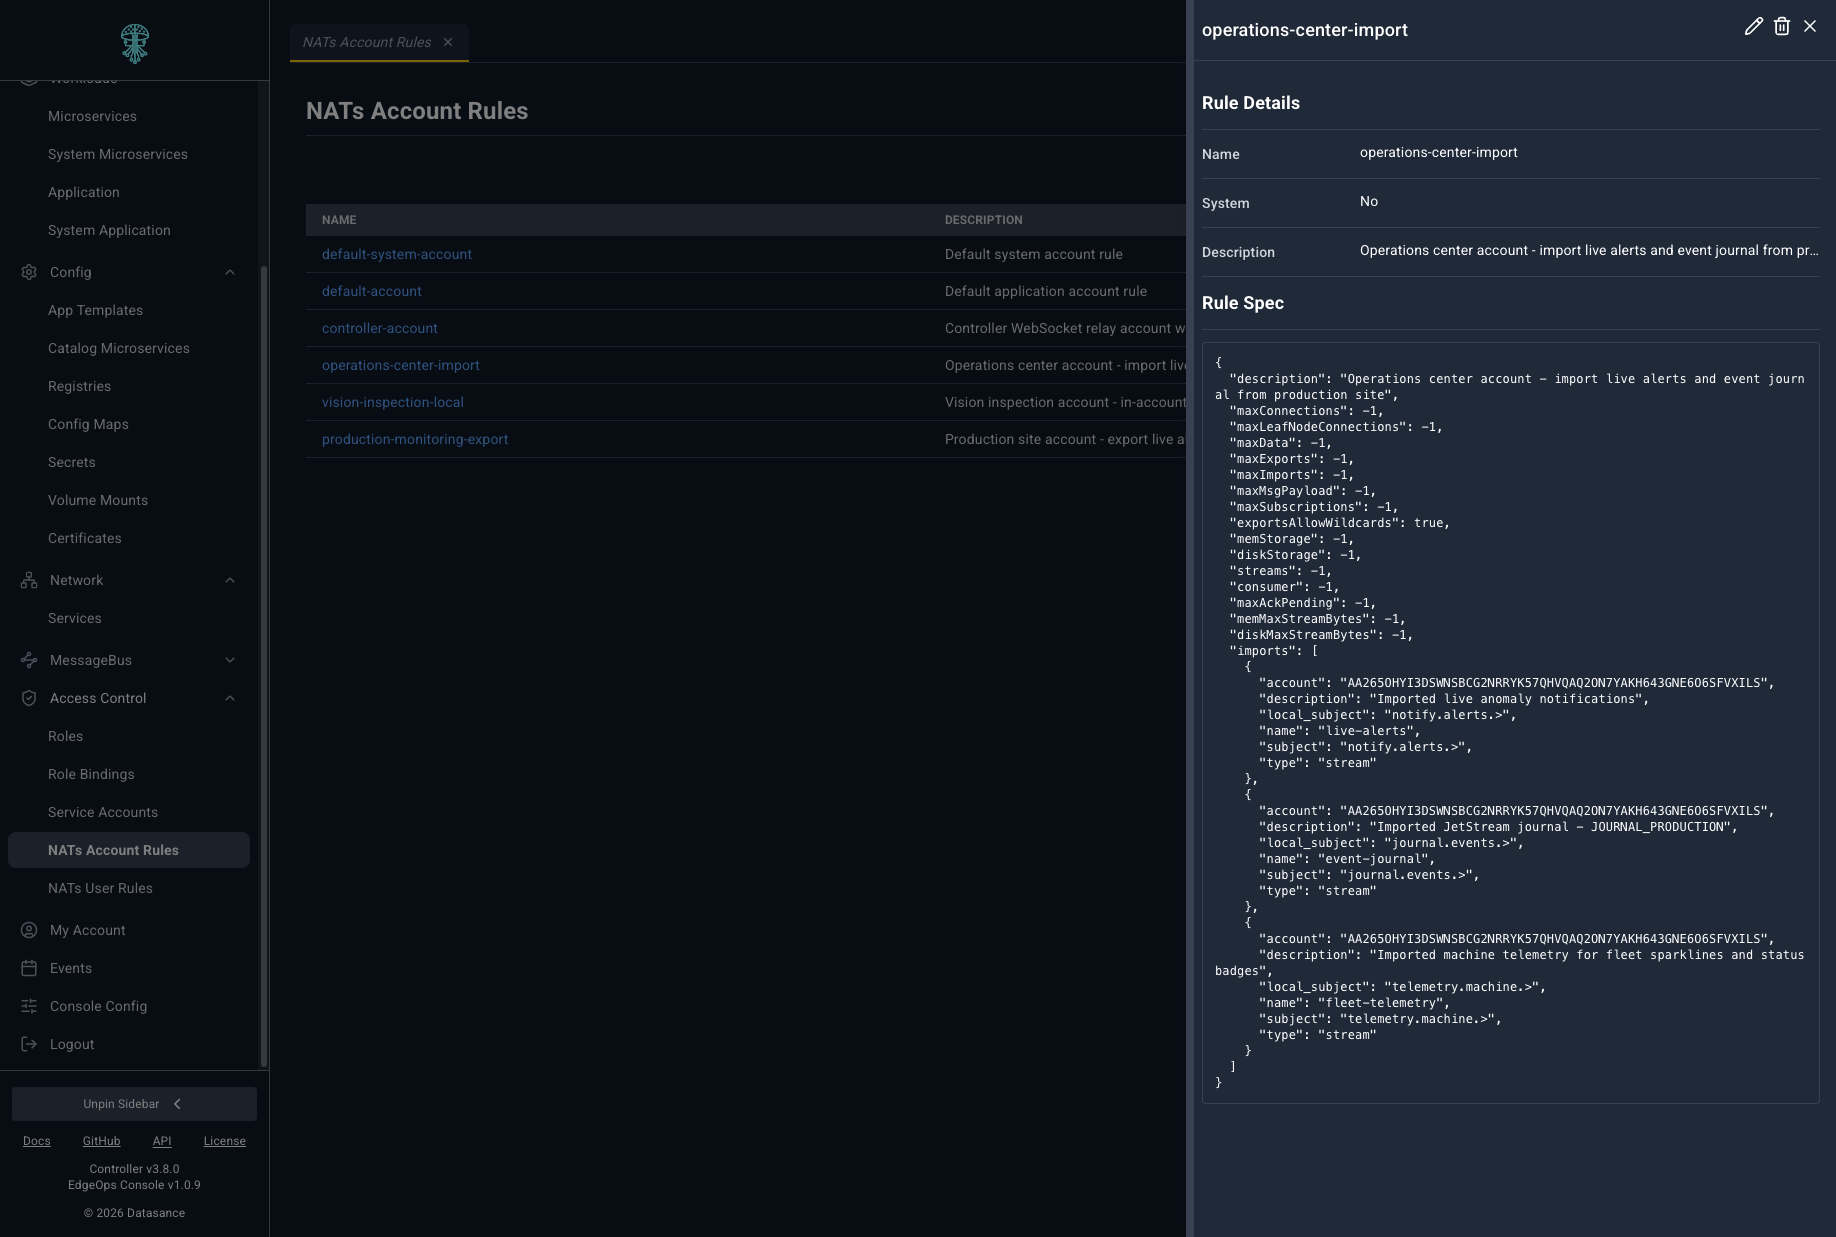
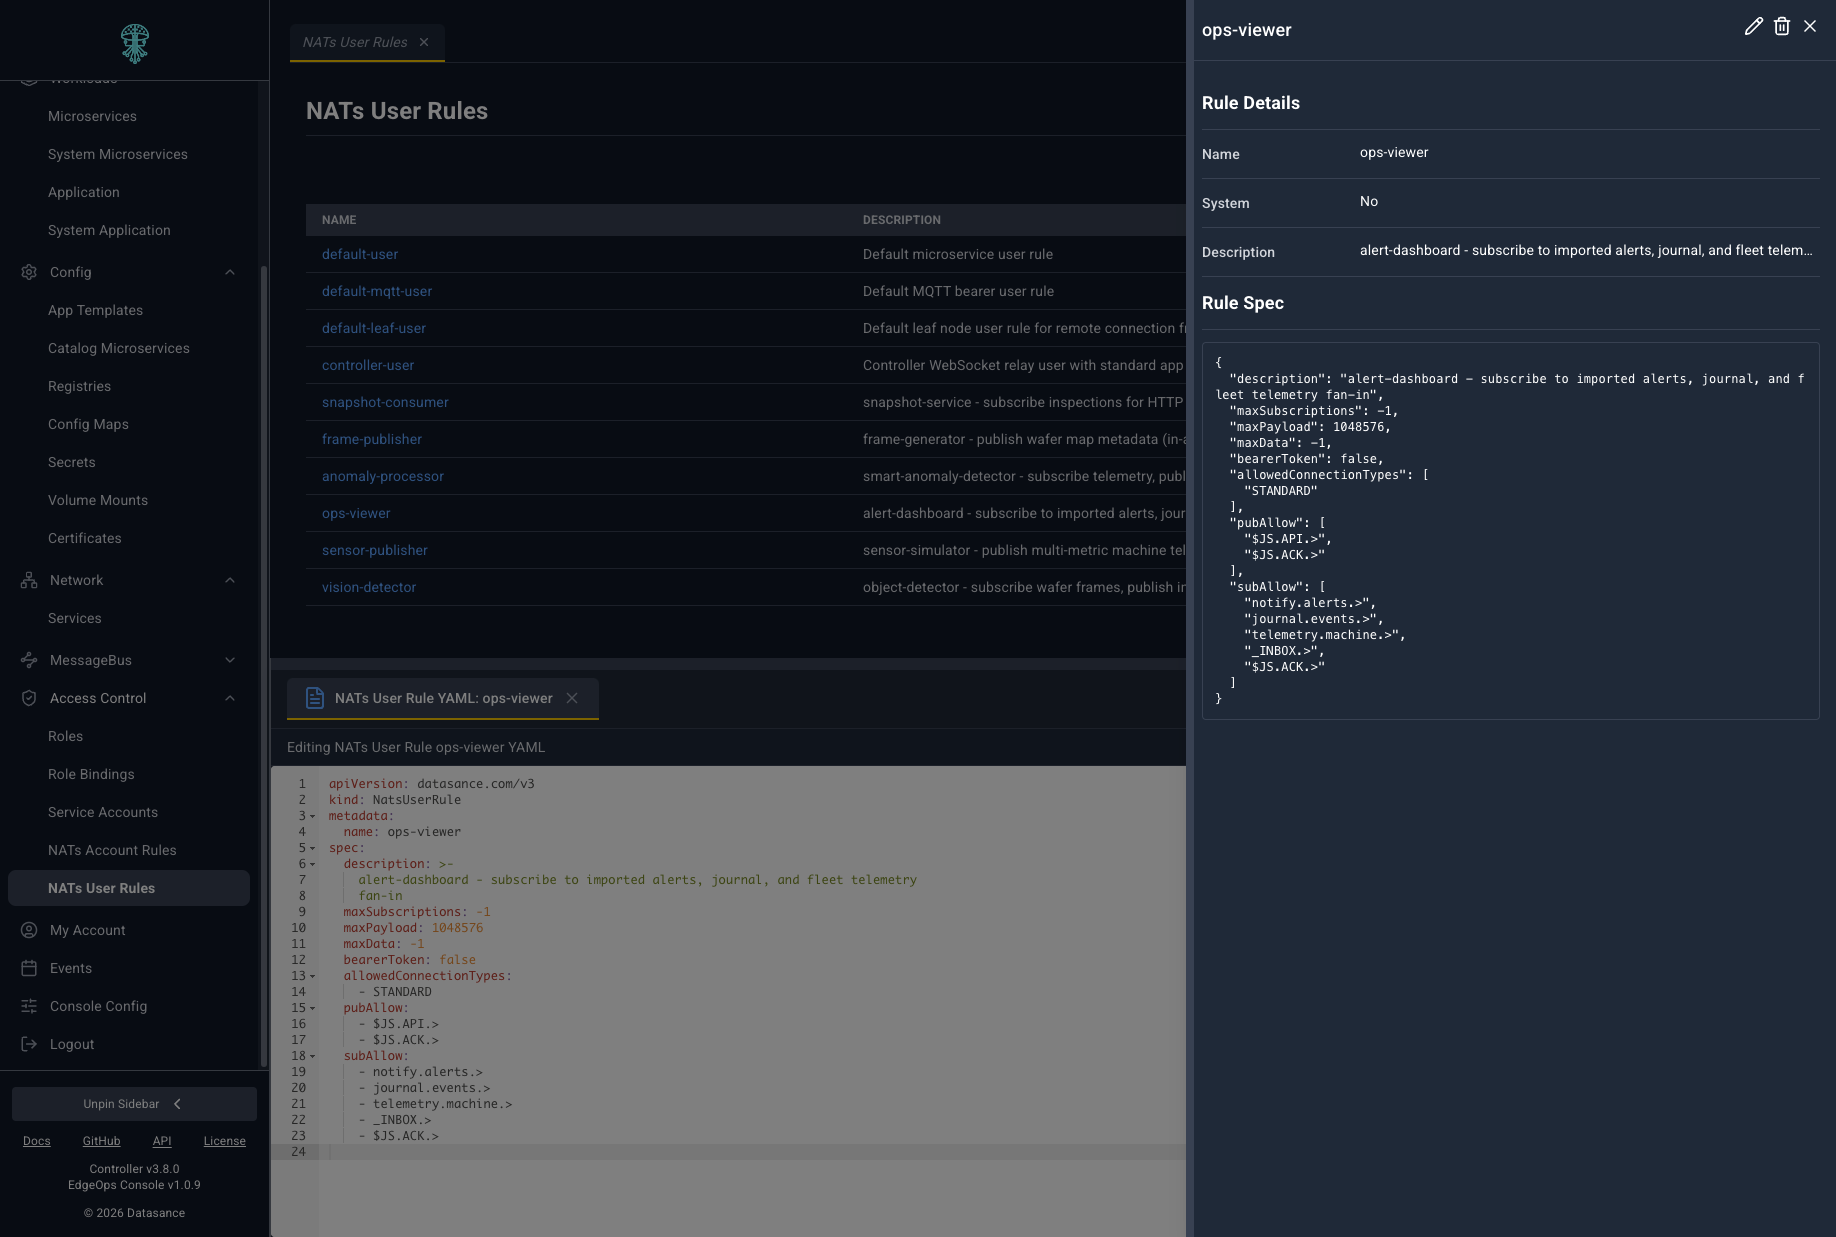
NATS account and user rules
Define export and import limits, publish and subscribe permissions, and account quotas under Access Control.
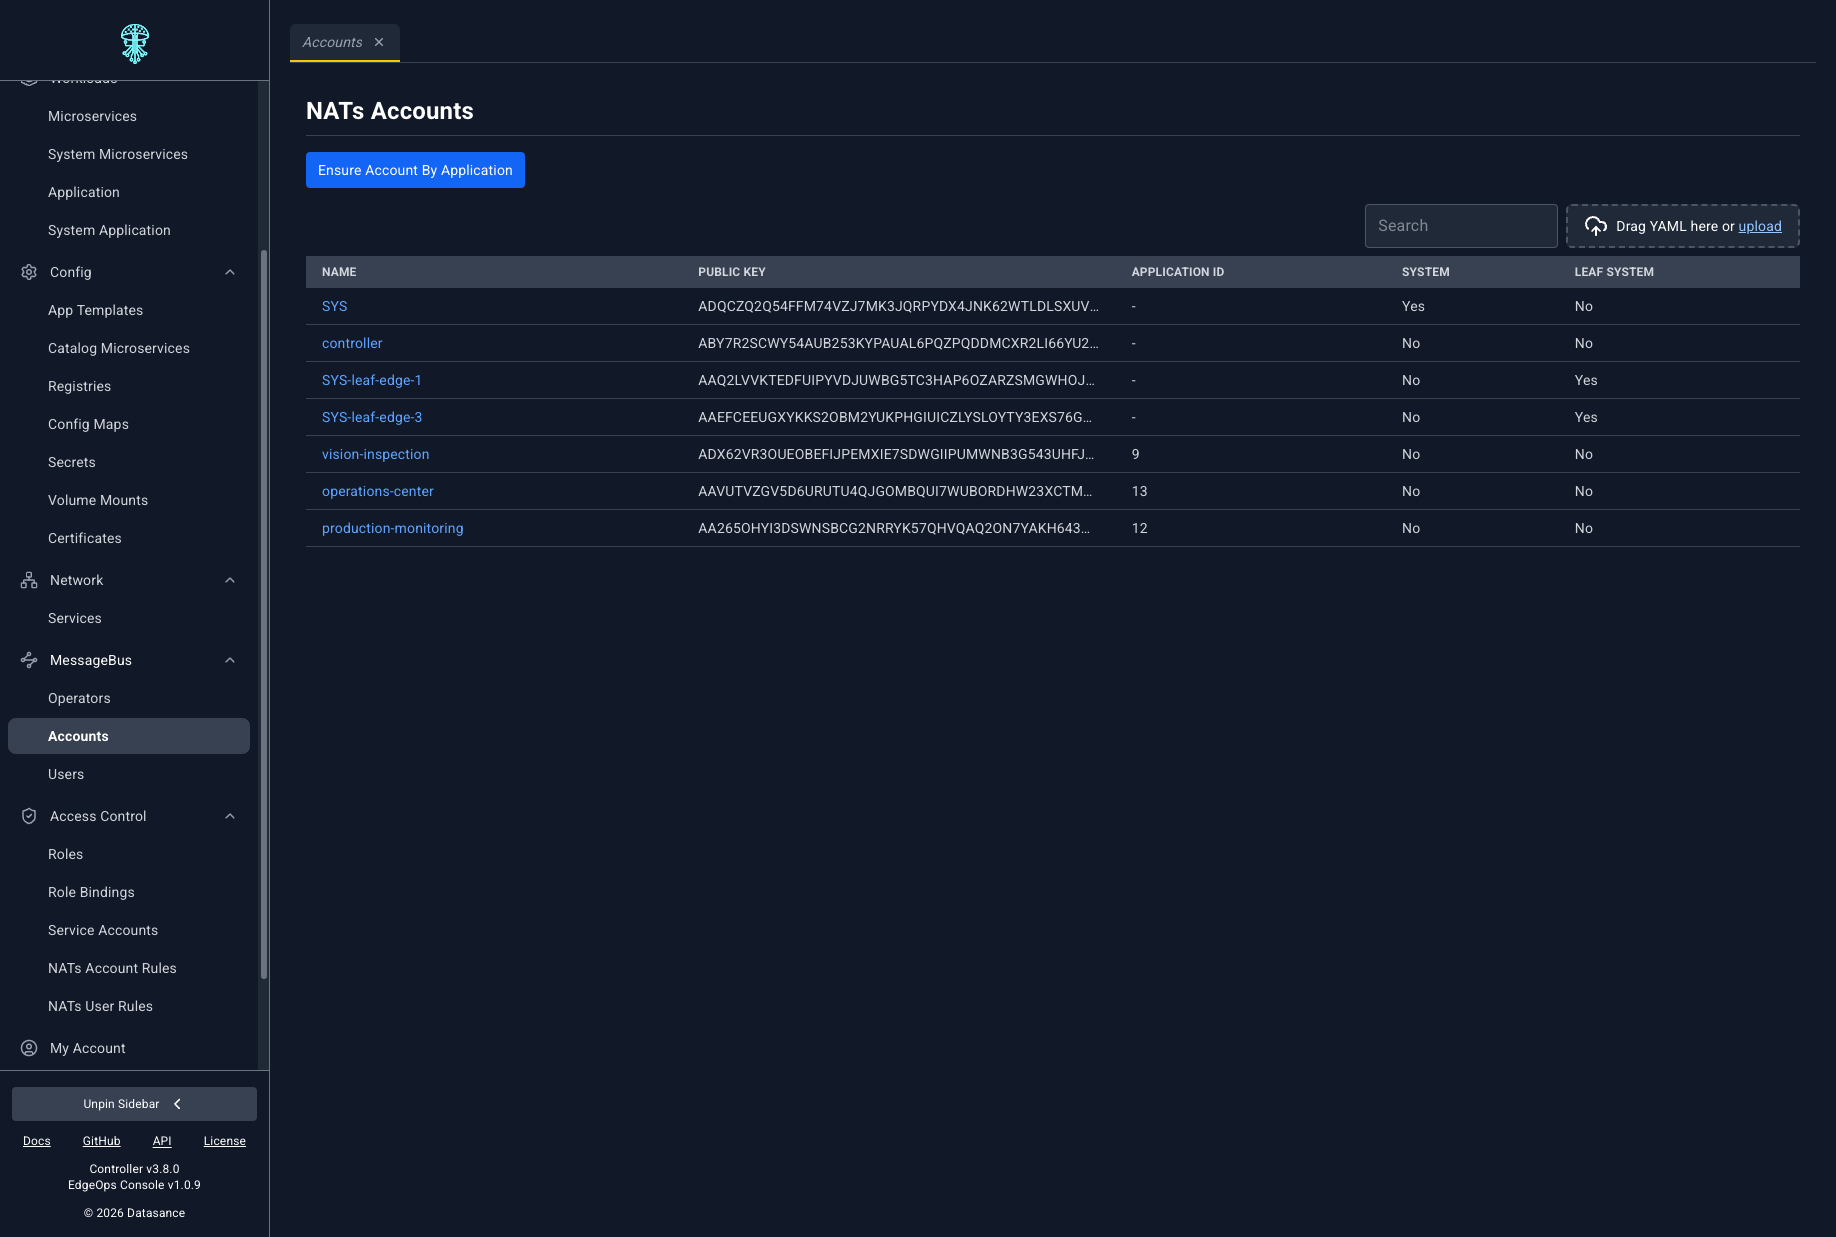
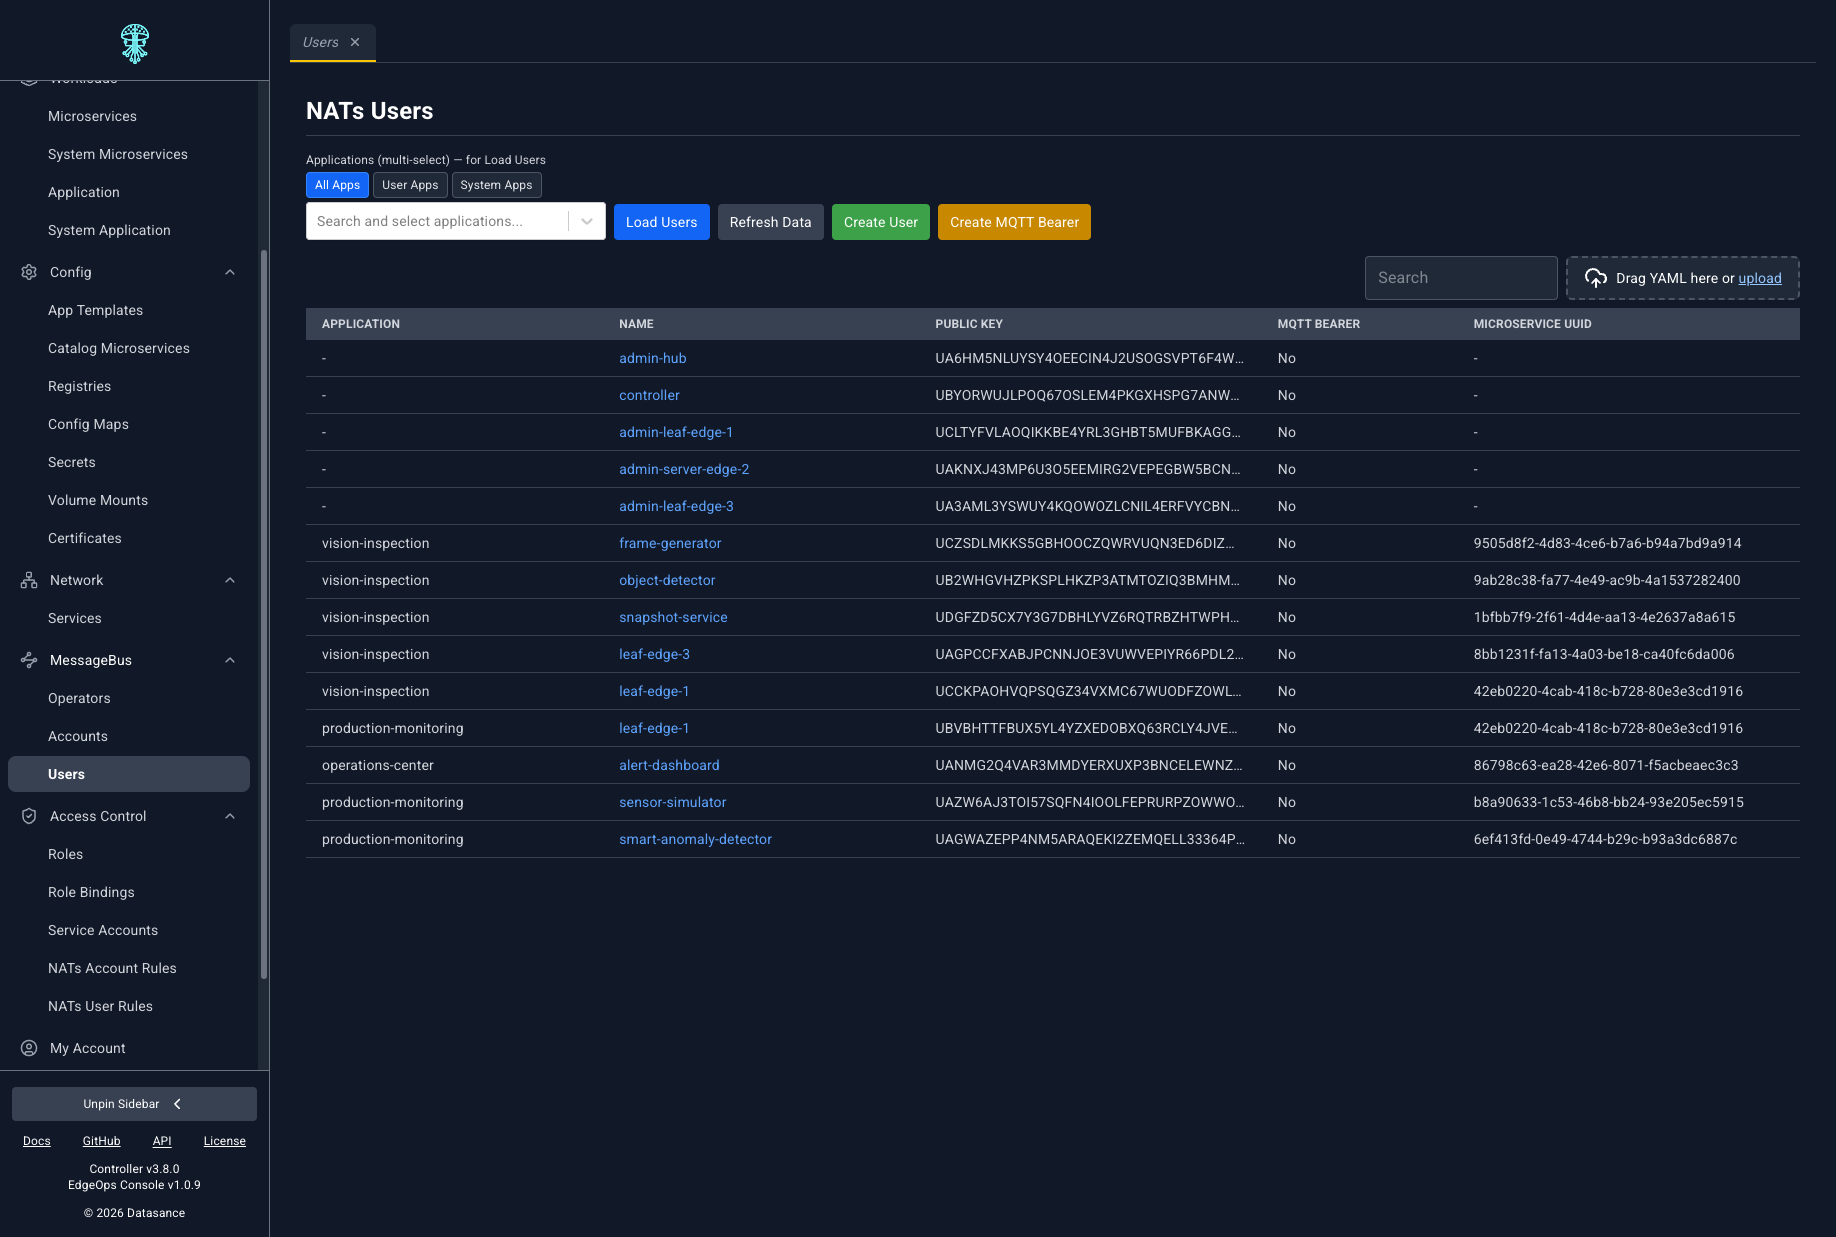
NATS accounts and users
Review provisioned NATS accounts and microservice users under MessageBus.
Roles, role bindings, and service accounts use the same Access Control section. Default greenfield installs use embedded OIDC.
Events and REST API explorer
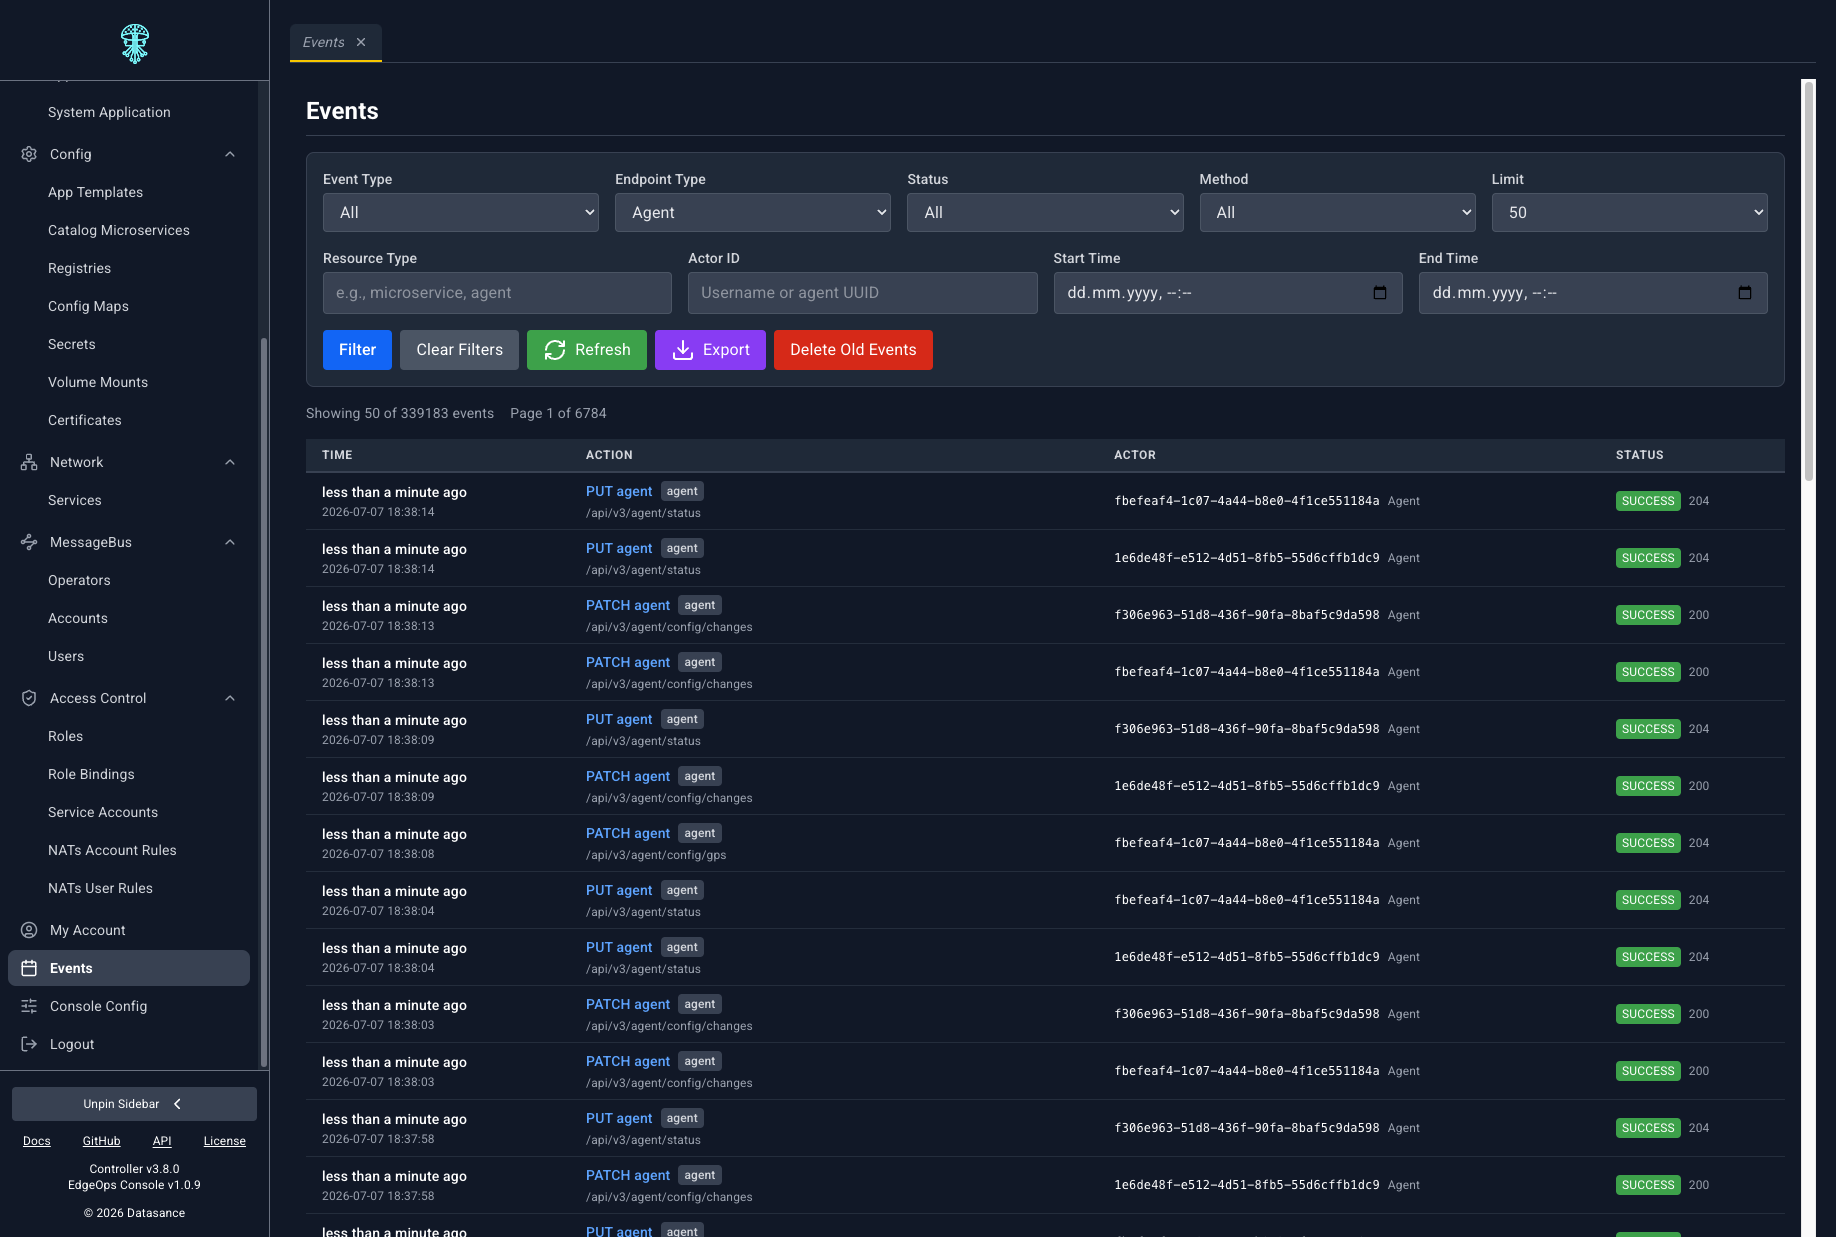
The Events view filters Controller API audit records by type, endpoint, status, actor, and time range. You can export or prune old events.
The embedded OpenAPI explorer calls /api/v3/... with the same auth context as the rest of the UI. Use it to exercise endpoints beyond what the form editors expose.
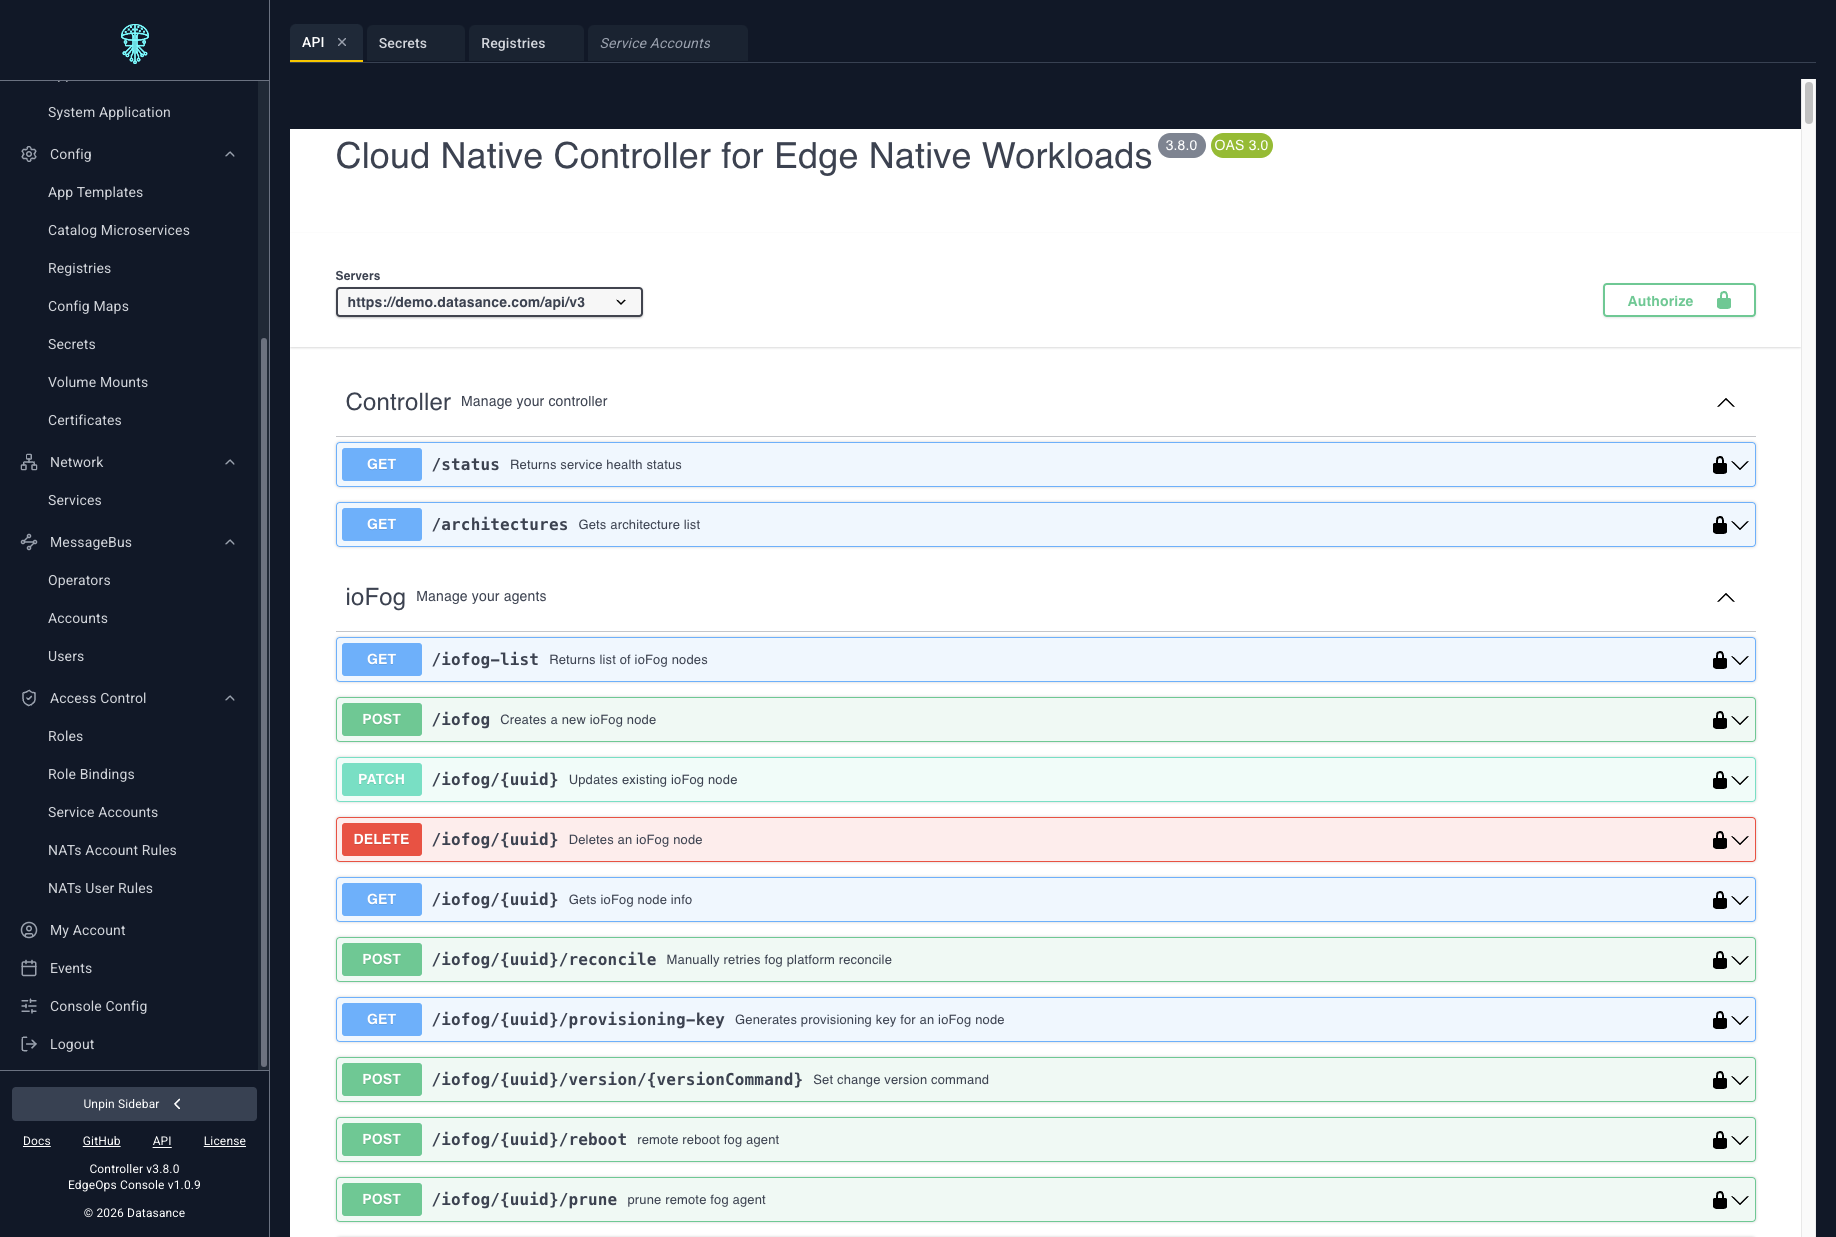
OpenAPI reference: Controller REST API.
Operational parity with the CLI
| Area | Console | potctl |
|---|---|---|
| Deploy and edit workloads | Yes | Yes |
| Cluster config resources | Yes | Yes |
| Exec and logs (WebSocket) | Yes | Yes |
| RBAC and audit | Same model | Same model |
| Initial Control Plane install | No | Yes |
| Edgelet node provisioning | No | Yes |
For automation-first workflows, use potctl or the REST API. For day-to-day visibility and controlled edits, use the Console.